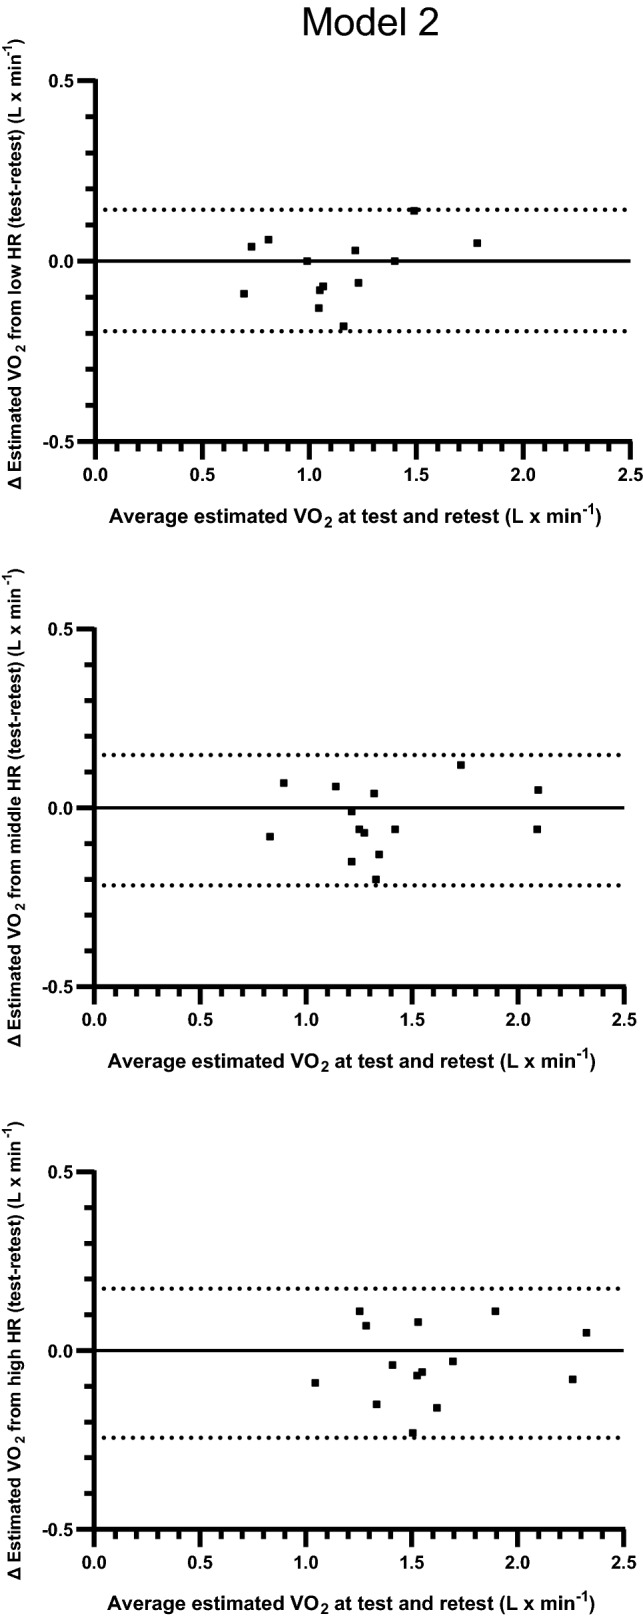
Fig. 3.

Individual levels of differences and the 95% limits of agreement between estimations of VO2 (L · min−1) calculated from fixed levels of low, middle and high HR from commuter walking as well as from repeated measurements of VO2–HR relations based on three submaximal work rates (Model 2). The y axes show absolute differences in VO2 against the mean values of the estimations from the repeated measurements on the x axes
