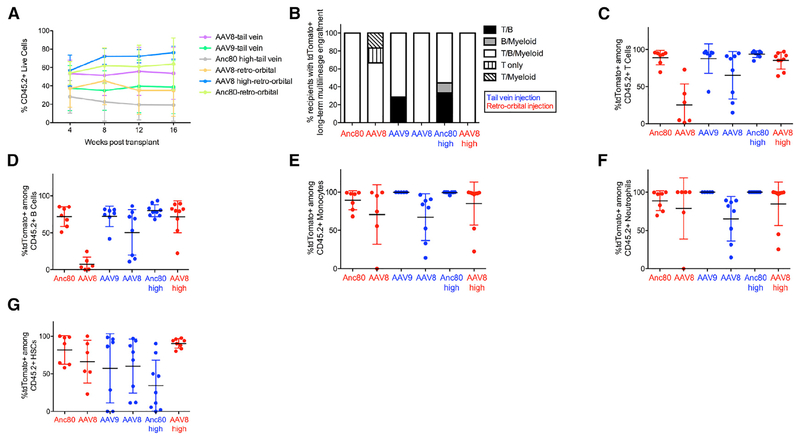
Figure 4. AAV-Transduced Hematopoietic Stem Cells Exhibit Long-Term Reconstitution Potential following Secondary Transplantation.
(A) Percentage of donor chimerism among live peripheral blood cells in secondary recipients at monthly intervals post-transplantation. Data points represent mean ± SD. n = 6–9 secondary recipients per group.
(B) Frequency of secondary recipients with tdTomato+ multilineage engraftment within indicated peripheral blood lineages at 16 weeks post-transplant. tdTomato+ engraftment was determined using the same criteria as in Figure 3E.
(C–F) Frequency of tdTomato+ cells among live CD45.2+ peripheral blood (C) T cells, (D) B cells, (E) monocytes, and (F) neutrophils in secondary recipients at 16 weeks post-transplantation. For each lineage, only recipients exhibiting >1% CD45.2+ cells within that lineage are shown. Individual data points are shown overlaid with mean ± SD. n = 6–9 mice per group.
(G) Percentage of tdTomato+ HSCs among CD45.2+ HSCs in secondary recipients at 4–5 months post-transplantation. Individual data points are shown overlaid with mean ± SD. n = 6–9 secondary recipients per group.
vg, viral genomes; Anc80, Anc80L65.
See also Figures S5 and S6 and Table S1.

