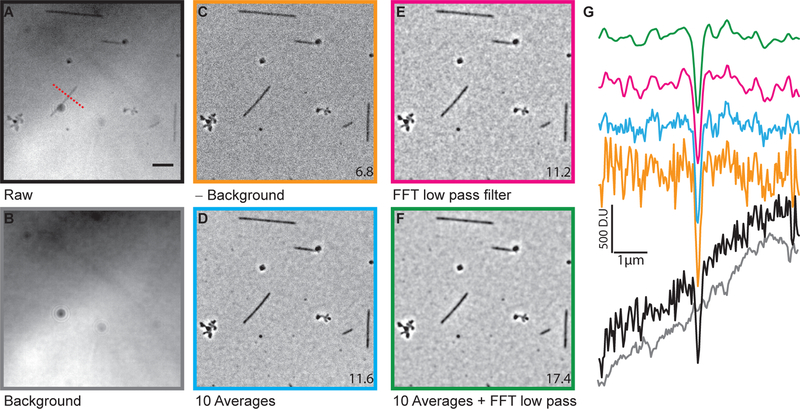
Figure 4. Image processing.
After acquiring raw images (A), the background (B) was subtracted (C) to enhance the microtubule contrast. To further improve the contrast the images were either averaged (D) or Fourier filtered (E) or both (F). The line scans (G), whose location is indicated by the dashed red line in (A) are color matched to the various images in (A) to (F). The numbers at the lower corner are average SBRs measured for the whole field of view. The scale bar is 5 μm (modified from15)

