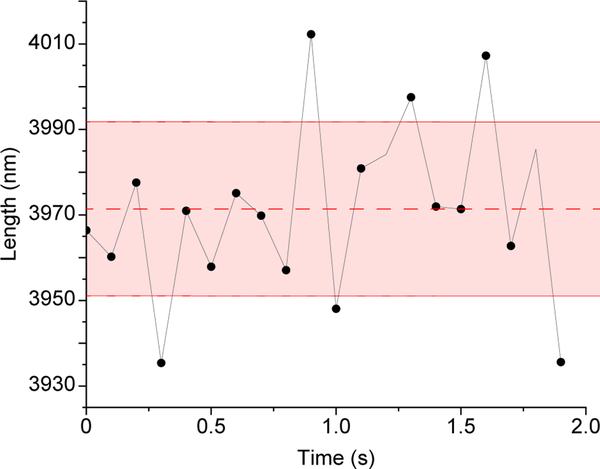
Figure 7. Microtubule length Tracking precision in IRM images.
Stabilized microtubules (i.e. fixed lengths) were imaged 200x at 100 fps then averaged to 10 fps to enhance contrast. Next, the microtubules’ lengths were measured using Fiesta17 tracking software. For every microtubule the mean length and standard deviation were calculated as shown in the figure (dashed line represents the mean and solid red lines represents the standard deviation, length = 3971 ± 20 nm. The overall tracking precision was the average of the standard deviation of all tracked microtubules (n = 6 microtubules x 20 data points = 120 data points)

