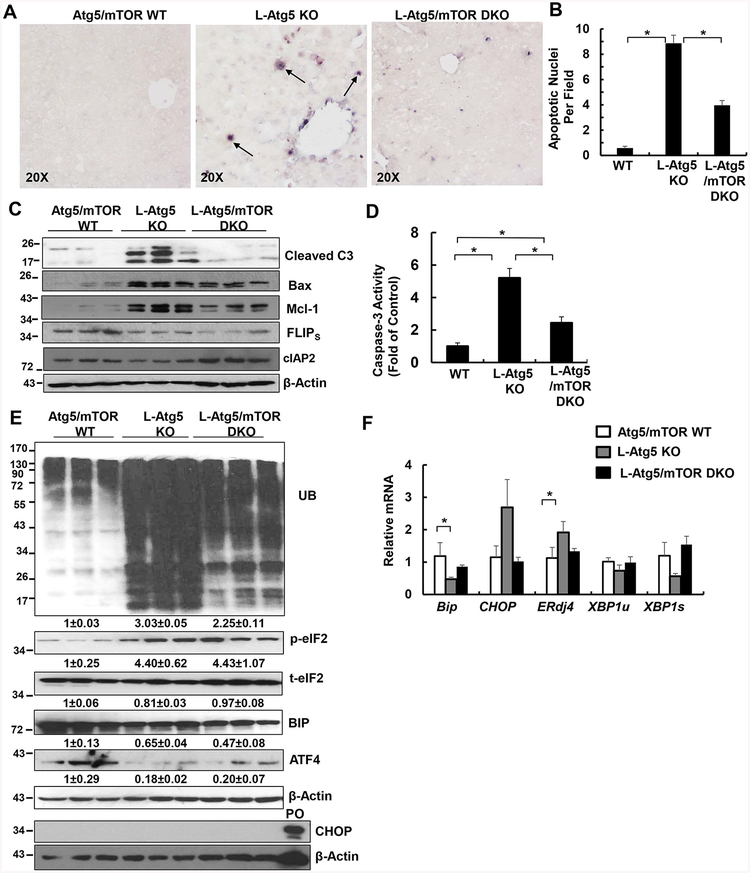
Figure 3. Deletion of mTOR attenuates apoptosis and levels of ubiquitinated protein in L-Atg5 KO mice.
(A) Representative photographs of TUNEL staining of mouse livers of Atg5/mTOR WT, L-Atg5 KO and L-Atg5/mTOR DKO at age of 2 months. Arrows: TUNEL positive cells. (B) Quantification of TUNEL positive cells from (A). Data are means± SEM from 3 different mice of at least 5–10 images counted in each mouse. (C) Total liver lysates of the indicated genotypes were subjected to western blot analysis and (D) caspase-3 activity assay. Data are presented as fold of control (means± SEM, n=8–9). * p<0.05 Student t Test. (E) Total liver lysates of the indicated genotypes were subjected to western blot analysis. PO: positive control of CHOP induction from thapsigargin-treated 293Tcells. Densitometry analysis data are presented as fold of control (means± SEM, n=3) (F) Quantitative real-time PCR analysis of the expression of hepatic ER stress genes. Total RNAs were prepared from livers of the indicated genotypes at age of 2 months. Data are presented as means± SEM (n=4). * p<0.05 One-Way Anova analysis with Scheffé’s post hoc test.

