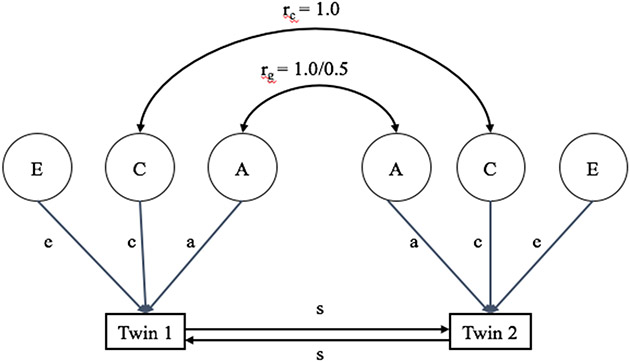
Figure 1.
Illustration of a univariate ACE twin model with sibling interaction effects. A refers to latent genetic influences on phenotype of interest; C refers to latent shared environmental influences on phenotype of interest, and E refers to latent non-shared environmental influences on phenotype of interest; a, c and e represent the portion of observed variance accounted for by A, C, and E, respectively; rc is the shared environmental correlation within twin pairs and is fixed at 1.0 regardless of zygosity; rg = the genetic correlation within twin pairs and is set to 1.0 for MZ pairs and 0.5 for DZ pairs; s represents the sibling interaction effect.

