
Figure 4. Lon inhibition induces E. coli filamentation following UV stress.
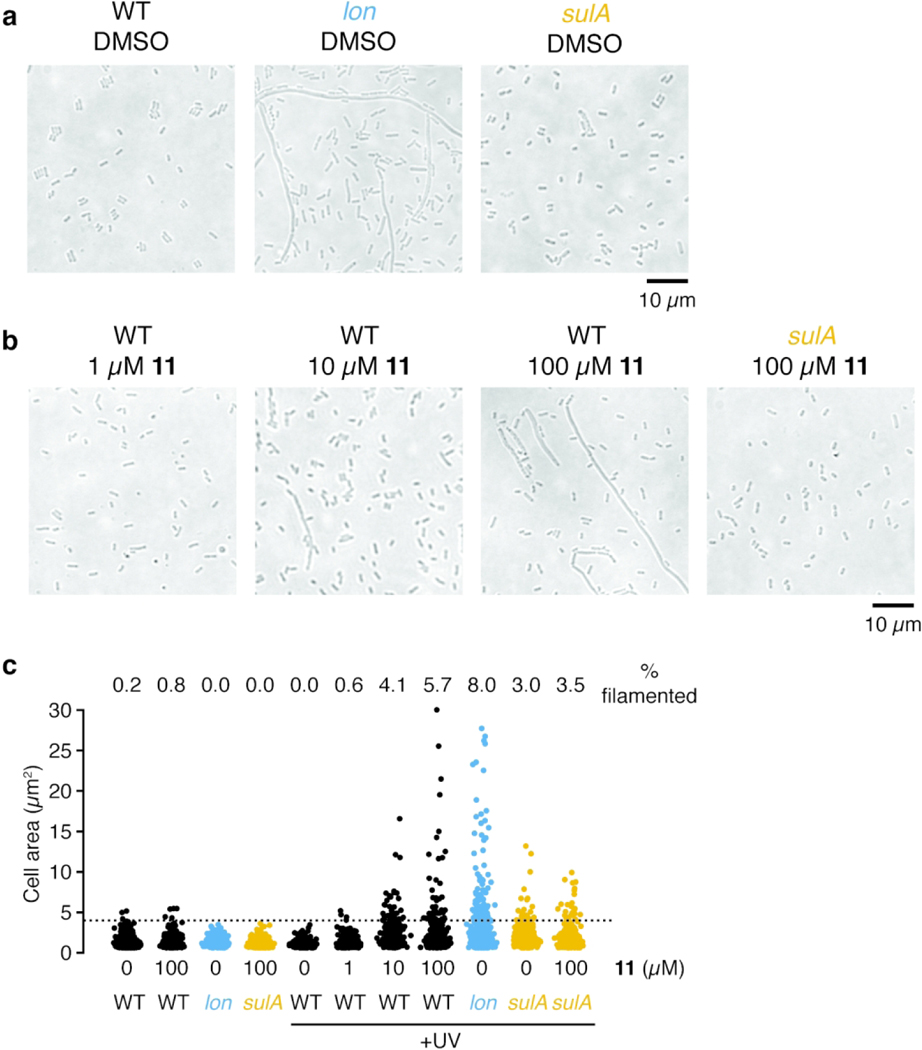
(a-b) Representative phase contrast images of E. coli strains exposed to UV light and then diluted into LB containing (a) DMSO or (b) various concentrations of 11. Cultures were grown for 6 h after UV-exposure and then imaged. Images are representative of two independent experiments. (c) Quantification of cell area for cells without UV-treatment or cells treated as in (a-b). The percent of cells with area greater than 4 μm2 (dashed line) is indicated (n<500 for each condition). Additional images are presented in Figure S6a.