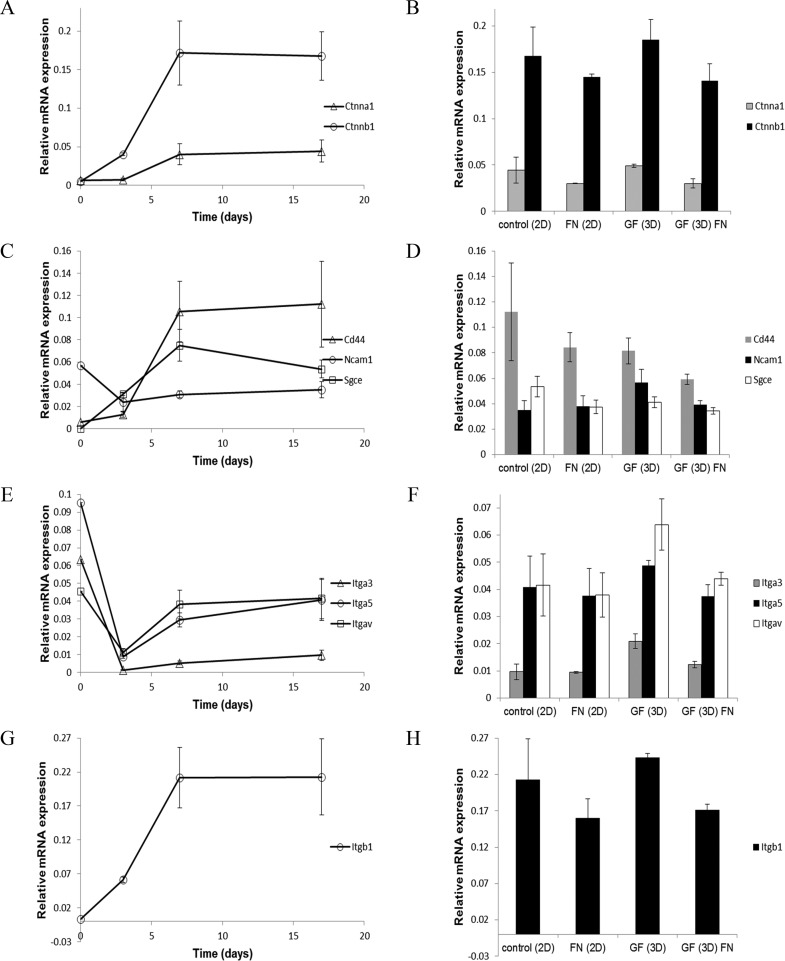
Figure 10.
Expression of genes encoding mediators of cell attachment by ATDC5 cells on glass-bottom tissue culture wells, GF, and fibronectin-GF. (A) Time course of gene expression during chondrogenic differentiation for Ctnnal (triangle) and Ctnnb1 (circle). (B) Relative gene expression levels of Ctnnal (gray) and Ctnnb1 (black) at day 17 of chondrogenic differentiation in control 2D culture, 2D culture in the presence of fibronectin, 3D-GF, and 3D-GF coated with fibronectin. (C) Time course of gene expression during chondrogenic differentiation for Cd44 (triangle), Ncam1 (circle), and Sgce (square). (D) Relative gene expression levels of Cd44 (gray), Ncam1 (black), and Sgce (white) at day 17 in control 2D culture, 2D culture in the presence of fibronectin, 3D-GF, and 3D-GF coated with fibronectin. (E) Time course of gene expression during chondrogenic differentiation for Itga3 (triangle), Itga5 (circle), and Itgav (square). (F) Relative gene expression levels of Itga3 (gray), Itga5 (black), and Itgav (white) at day 17 in control 2D culture, 2D culture in the presence of fibronectin, 3D-GF, and 3D-GF coated with fibronectin. (G) Time course of gene expression during chondrogenic differentiation for Itgb1. (H) Relative gene expression levels of Itgb1 at day 17 in control 2D culture, 2D culture in the presence of fibronectin, 3D-GF, and 3D-GF coated with fibronectin. Error bars = Mean ± SD. These genes are listed in Table 1 with references from current literature indicating an association with chondrocyte differentiation.

