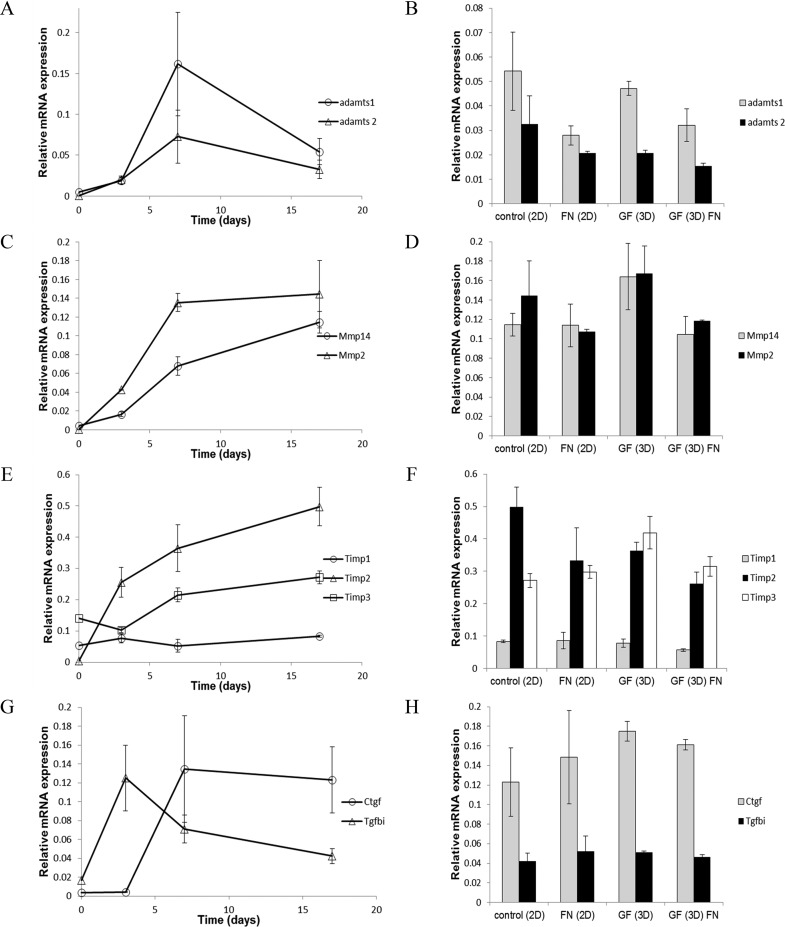
Figure 12.
Expression of genes encoding matrix remodeling proteins and their endogenous inhibitors by ATDC5 cells on glass-bottom tissue culture wells, GF, and fibronectin-GF. (A) Time course of gene expression during chondrogenic differentiation for Adamts1 (circle) and Adamts2 (triangle). (B) Relative gene expression levels of Adamts1 (gray) and Adamts2 (black) at day 17 of chondrogenic differentiation in control 2D culture, 2D culture in the presence of fibronectin, 3D-GF, and 3D-GF coated with fibronectin. (C) Time course of gene expression during chondrogenic differentiation for Mmp2 (triangle) and Mmp14 (circle). (D) Relative gene expression levels of Mmp2 (black) and Mmp14 (gray) at day 17 in control 2D culture, 2D culture in the presence of fibronectin, 3D-GF, and 3D-GF coated with fibronectin. (E) Time course of gene expression during chondrogenic differentiation for Timp1 (circle), Timp2 (triangle), and Timp3 (square). (F) Relative gene expression levels of Timp1 (gray), Timp2 (black), and Timp3 (white) at day 17 in control 2D culture, 2D culture in the presence of fibronectin, 3D-GF, and 3D-GF coated with fibronectin. (G) Time course of gene expression during chondrogenic differentiation for Ctgf (circle) and Tgfbi (triangle). (H) Relative gene expression levels of Ctgf (gray) and Tgfbi (black) at day 17 in control 2D culture, 2D culture in the presence of fibronectin, 3D-GF, and 3D-GF coated with fibronectin. Error bars = Mean ± SD Table 3 lists matrix remodeling genes analyzed in this study with descriptions and literature citations that have demonstrated a link between increases in gene expression and chondrogenic differentiation.

