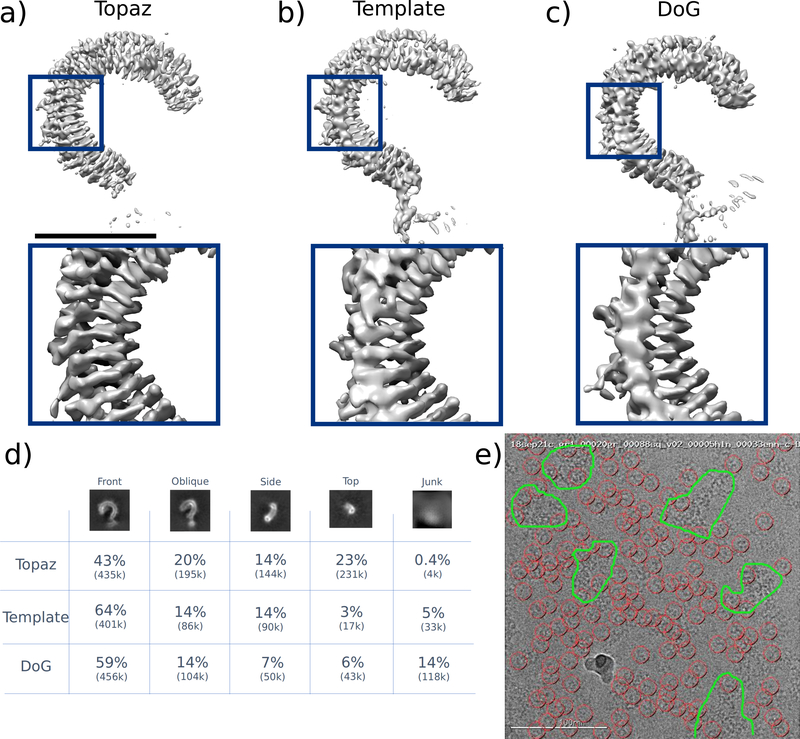
Figure 2 |.
Reconstructions of the Toll receptor using particles picked by Topaz, template-based (Template), and DoG methods. Template and DoG particles were filtered through multiple rounds of 2D classification before analysis. Topaz particles were not filtered. (a) Density map using particles picked with Topaz. The global resolution is 3.70 Å at FSC0.143 with a sphericity of 0.731. (b) Density map using particles picked using template picking. The global resolution is 3.92 Å at FSC0.143 with a sphericity of 0.706. (c) Density map using particles picked using difference of Gaussians (DoG). The global resolution is 3.86 Å at FSC0.143 with a sphericity of 0.652. (d) Quantification of picked particles for each protein view based on 2D classification. (e) Example micrograph (representative of >100 micrographs examined) showing Topaz picks (red circles) and protein aggregation (outlined in green). Scale bar for the top of (a) is 5 nm.

