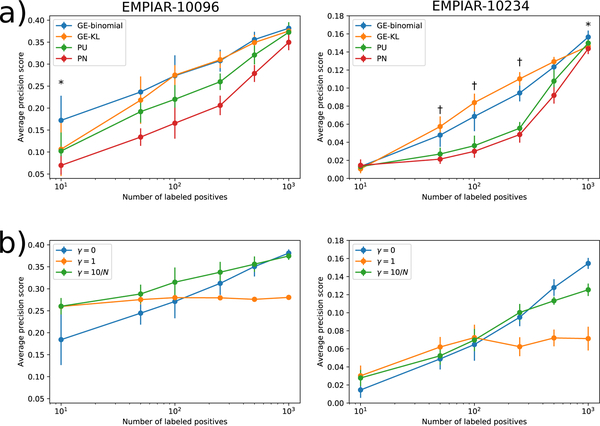
Figure 5 |.
Comparison of models trained using different objective functions with varying numbers of labeled positives on the EMPIAR-10096 and EMPIAR-10234 datasets. (a) Plots show the mean and standard deviation of the average-precision score for predicting positive regions in the EMPIAR-10096 and EMPIAR-10234 test set micrographs for models trained using either the naive PN, Kiryo et al.’s non-negative risk estimator (PU), our GE-KL, or our GE-binomial objective function. Each number of labeled positives was sampled 10 times independently. (*) indicates experiments in which GE-binomial achieved higher average-precision than GE-KL with p < 0.05. (†) indicates experiments in which GE-KL achieved higher average-precision than GE-binomial with p < 0.05 according to a two-sided dependent t-test. (b) Plots show the mean and standard deviation of the average-precision score for models trained jointly with autoencoders with different reconstruction loss weights (γ). γ=0 corresponds to training the classifier without the autoencoder. γ=10/N means the reconstruction loss is weighted by 10 divided by the number of labeled positives used to train the model.

