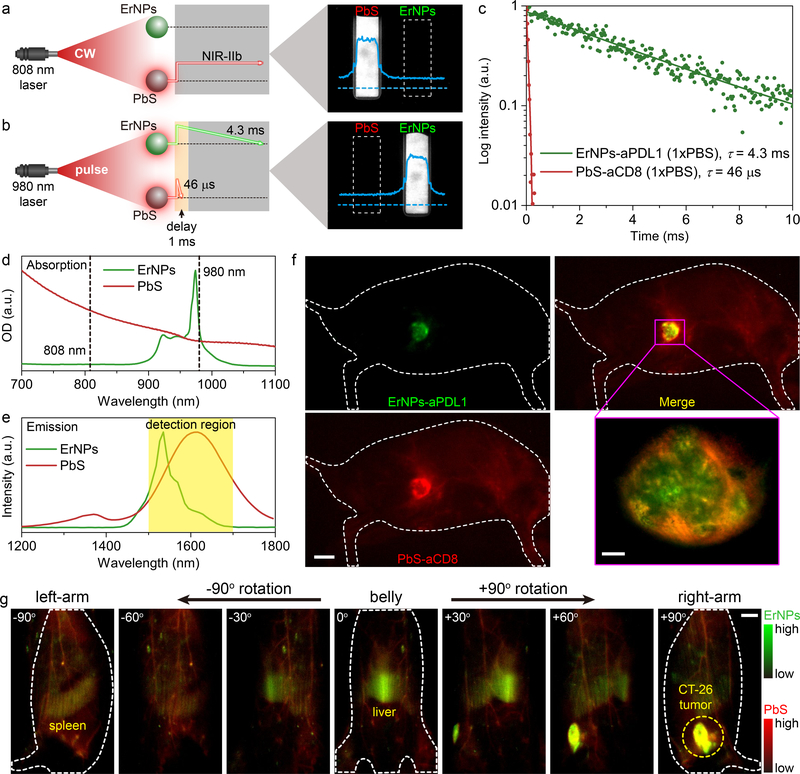
Figure 4: In vivo two-plex NIR-IIb molecular imaging of immune responses using ErNPs-aPDL1 and PbS-aCD8 at the same ~1600 nm emission range.
a, Schematic illustration outlining the experimental setup (left) to distinguish the PbS QDs emission channel (right) by using an 808 nm CW laser. b, Schematic of the experimental setup (left) to differentiate the long-lived ErNPs luminescence (right) from short-lived PbS QDs fluorescence by using a 980 nm laser pulse. The insets showed corresponding cross-sectional intensity profiles (blue color). c, Lifetime decays of ErNPs-aPDL1 and PbS-aCD8 in phosphate buffered saline solution (1xPBS). d, Absorption spectra of ErNPs-aPDL1 and PbS-aCD8. e, Emission spectra of ErNPs-aPDL1 and PbS-aCD8. The detection region is 1500–1700 nm. f, Two-plex molecular imaging (upper right) of a CT-26 tumor mouse at 24 hrs post intravenous injection of mixed ErNPs-aPDL1 (green color, upper left) and PbS-aCD8 (red color, lower left). Scale bar: 5 mm. The zoomed-in high-magnification two-plex image (lower right) outlined the CT-26 tumor with micrometer image resolution (scale bar: 500 μm). g, Corresponding two-plex rotation (−90° to +90°) imaging showed the in vivo bio-distribution of ErNPs-aPDL1 (green color) and PbS-aCD8 (red color) in the whole body. Scale bar: 5 mm. Similar results for n > 3 independent experiments.

