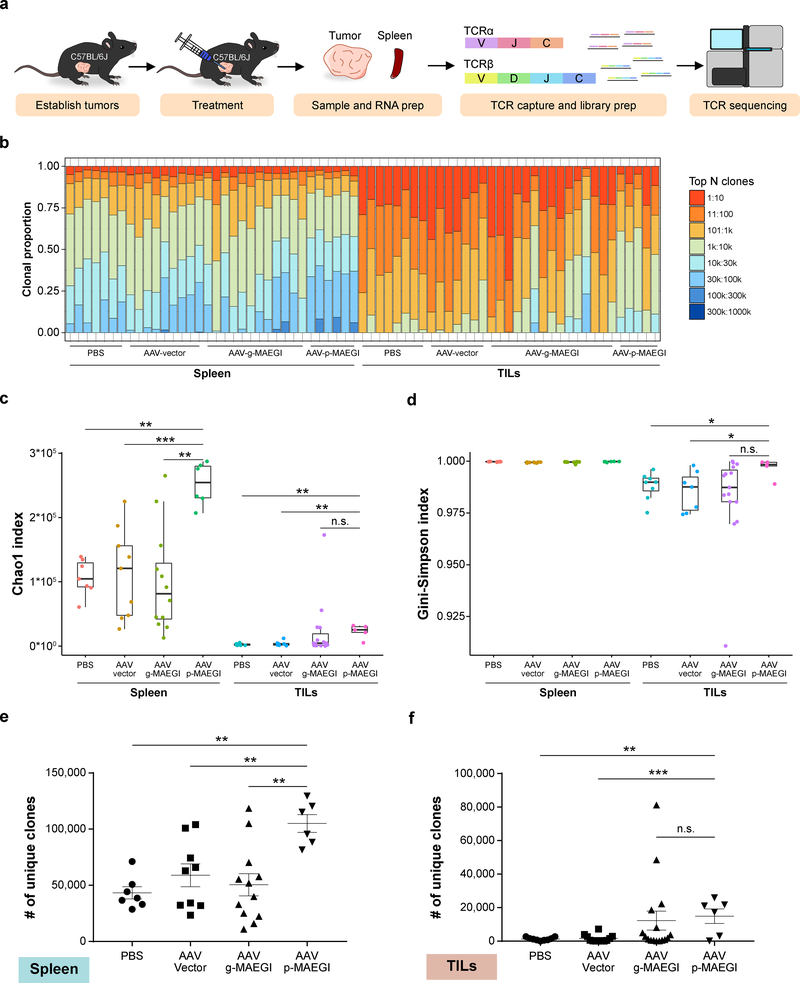
Figure 6. Interrogation of the T cell repertoire in MAEGI-treated mice by TCR sequencing.
a, Schematics of TCR-seq experiment design. Mice bearing E0771-dCas9-VP64 tumors were treated with PBS, AAV-Vector, AAV-g-MAEGI (genome-wide), or AAV-p-MAEGI (exome-guided). Spleens and tumors were harvested and subjected to RT-based TCRα/TCRβ capture followed by Illumina sequencing. In spleen samples, n = 7 (PBS-treated mice), n = 9 (AAV-Vector treated mice), n = 12 (AAV-g-MAEGI treated mice), n = 6 (AAV-p-MAEGI treated mice) from two independent experiments. In the tumor-infiltrating lymphocytes (TILs) samples, n = 7 (PBS-treated mice), n = 7 (AAV-Vector treated mice), n = 15 (AAV-g-MAEGI treated mice), n = 5 (AAV-p-MAEGI treated mice) from two independent experiments. b, Global clonal proportion plot showing the relative frequencies of the top N clones. c, Boxplot of Chao1 indices (TCR diversity) for each group. Unpaired two-tailed Mann-Whitney test, spleens: AAV-p-MAEGI vs. PBS, p = 0.0012; AAV-p-MAEGI vs. AAV-Vector, p = 0.0008; AAV-p-MAEGI vs. AAV-g-MAEGI, p = 0.0013. Unpaired two-tailed Mann-Whitney test, TILs: AAV-p-MAEGI vs. PBS, p = 0.0031; AAV-p-MAEGI vs. AAV-Vector, p = 0.0051; AAV-p-MAEGI vs. AAV-g-MAEGI, p = 0.0983. d, Boxplot of Gini-Simpson indices (TCR evenness) for each group. Two-tailed Mann-Whitney test, TILs: AAV-p-MAEGI vs. PBS, p = 0.0295; AAV-p-MAEGI vs. AAV-Vector, p = 0.0303 AAV-p-MAEGI vs. AAV-g-MAEGI, p = 0.0526. e-f, Dot plots of the number of unique clonotypes identified (TCR richness) in each spleen sample (e) or TILs sample (f), compared across treatment conditions. Statistical significance was assessed by unpaired two-tailed t-test. Spleen: AAV-p-MAEGI vs. PBS, p = 0.002; AAV-p-MAEGI vs. AAV-Vector, p = 0.006 AAV-p-MAEGI vs. AAV-g-MAEGI, p = 0.0023. TILs: AAV-p-MAEGI vs. PBS, p = 0.002; AAV-p-MAEGI vs. AAV-Vector, p = 0.0006, AAV-p-MAEGI vs. AAV-g-MAEGI, p = 0.7875. All boxplots are Tukey boxplots (interquartile range (IQR) boxes with 1.5 × IQR whiskers). Error bars: Data points in this figure are presented as mean ± s.e.m. Asterisks: * p < 0.05, ** p < 0.01, *** p < 0.001.
Additional supporting data: Supplementary Figure 6

