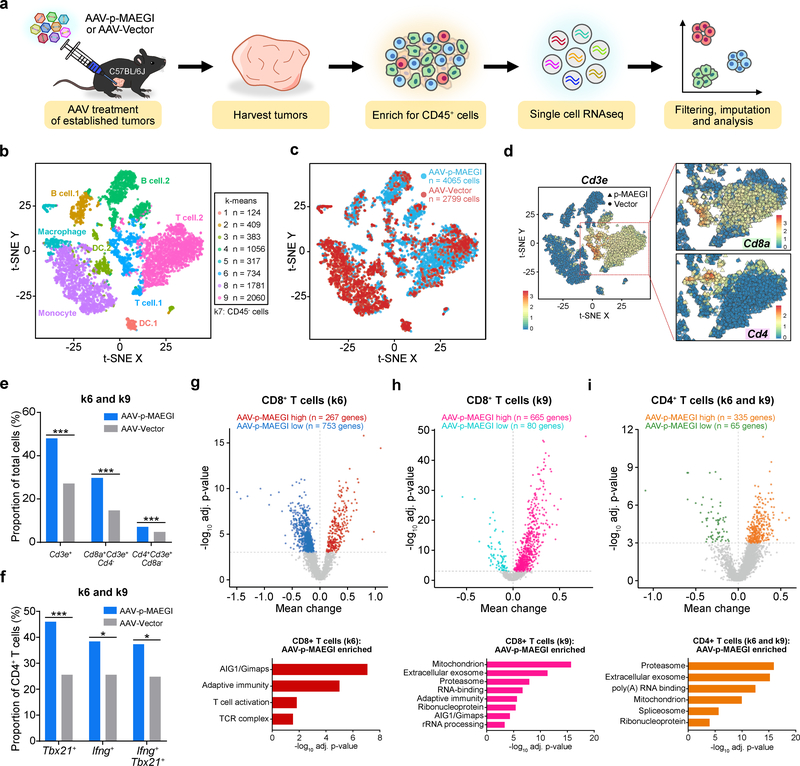
Figure 7. Single cell RNA-seq profiling of immune populations in the tumor microenvironment.
a, Schematic of experimental design for single cell RNA-seq (scRNA-seq) analysis of immune populations. Cells from n = 3 independent mice (AAV-Vector) or n =3 mice (AAV-p-MAEGI) were pooled together for scRNA-seq library preparation. b, Scatter plot of t-SNE dimensional reduction, with cells colored by k-means cluster (cell numbers detailed on right). Putative cell types associated with each cluster are annotated. Cluster 7 (k7) is composed of CD45- cells and was excluded from further analyses (see Supplementary Fig. 7). c, Scatter plot of t-SNE dimensional reduction as in (b), colored by treatment group. scRNA-seq cell numbers after preprocessing: AAV-p-MAEGI, n = 4,065 cells; AAV-Vector, n = 2,799 cells. d, Identification of T cell populations from scRNA-seq. Left, t-SNE dimensional reduction, with cells colored by Cd3e expression. Right, zoomed-in view of clusters k6 and k9, colored by Cd8a expression (top) or Cd4 expression (bottom). e, Quantification of T cell populations in k6 and k9, out of total cells (AAV-p-MAEGI, n = 4,065 cells; AAV-Vector, n = 2,799). Two-sided Fisher’s exact test: p < 0.0001 for CD3+ T cells, CD8+ T cells, and CD4+ T cells. f, Quantification of putative CD4+ T cell subpopulations in k6 and k9 out of total CD4+ T cells (AAV-p-MAEGI, n = 289 cells; AAV-Vector, n = 133). Two-sided Fisher’s exact test: p < 0.0001 for Tbx21+ cells, p = 0.0111 for Ifng+ cells, and p = 0.0109 for Tbx21+Ifng+ cells. g-i, Top, differential expression volcano plots of CD8+ T cells in k6 (g), CD8+ T cells in k9 (h), and CD4+ T cells in k6 and k9 (i), comparing AAV-p-MAEGI to AAV-Vector. n = number of differentially expressed genes, assessed by two-sided Mann Whitney test with Benjamini-Hochberg multiple hypothesis correction. Bottom, gene ontology enrichment analysis of upregulated genes in T cells from AAV-p-MAEGI mice, determined by Fischer’s exact test with Benjamini-Hochberg multiple hypothesis correction. Error bars: All data points in this figure are presented as mean ± s.e.m. Asterisks: * p < 0.05, ** p < 0.01, *** p < 0.001.
Additional supporting data: Supplementary Figure 7

