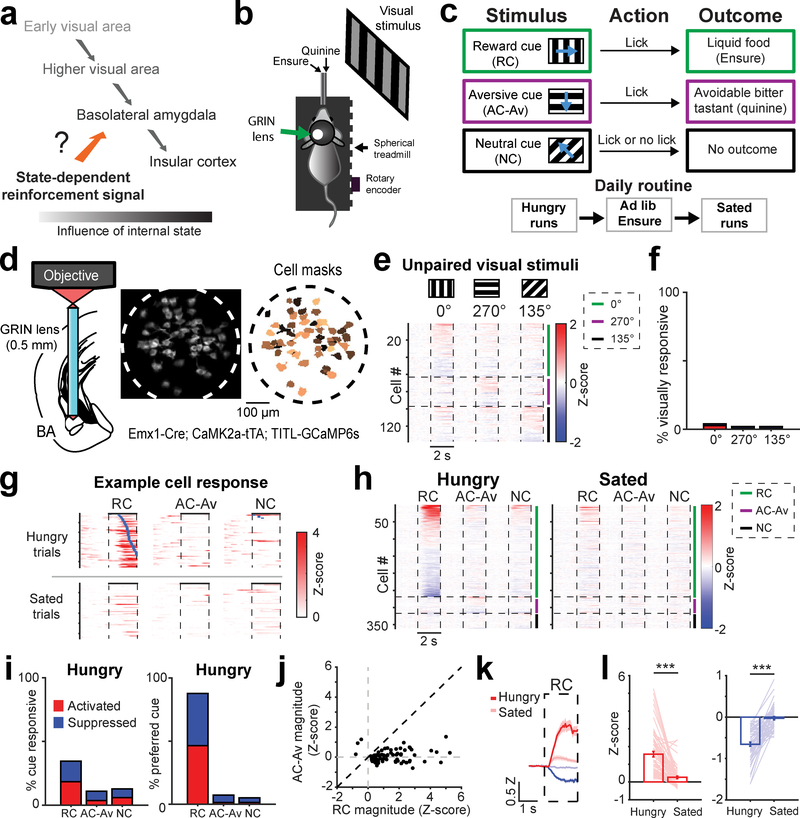
Fig. 1 |. Mouse basal amygdala neurons acquire hunger-dependent responses to food-predicting cues.
a, Visual responses along the visual pathway increasingly depend on learned motivational relevance in humans and mice. Inputs to basolateral amygdala (BLA) that relay state-specific reinforcement signals may regulate acquisition and expression of learned responses to motivationally salient cues.
b, Schematic of head-fixed Go/NoGo visual discrimination task and imaging setup.
c, Visual discrimination task. Mice learn that behavioral responses (licks) in the 2-s window following presentation of the 2-s reward cue (RC; oriented drifting grating) lead to liquid food delivery (Ensure). Licking following the aversive cue (AC-Av) leads to quinine delivery. This aversive outcome can be passively avoided by withholding licking. Licking following the neutral cue (NC) does not result in any outcome, regardless of action.
d, Left: schematic of two-photon imaging of basal amygdala (BA) neurons using a GRIN lens (0.5 mm diameter) in transgenic mice expressing GCaMP6s in excitatory neurons. Middle: example field of view (ICA-based weighted cell masks, see Methods). Right: binarized cell masks for all active neurons, pseudocolored for visualization purposes.
e, Heatmap with rows depicting mean responses of BA neurons (n = 137 neurons, 6 fields of view from 4 mice) to visual stimuli prior to associative learning, sorted by magnitude of cue response and grouped by preferred cue type for visualization. Vertical dashed lines demarcate visual stimulus onsets and offsets. Horizontal lines demarcate sorting of neurons by preferred cue (cue with the largest absolute value response). Grouping by preferred cue is also indicated by colored vertical bars to the right of the heatmap (green: 0º; purple: 270º; black: 135º).
f, Percentage of all neurons shown in panel e that had a significant response to visual stimuli (see Methods; 0°: 6/137 neurons; 270°: 3/137; 135°: 3/137).
g, Single-trial responses of an example RC-preferring neuron following associative learning. Following satiation, this neuron becomes unresponsive. Rows: trials sorted by onset of first lick (blue ticks) after visual stimulus onset.
h, Heatmap depicting mean responses of all BA neurons (n = 360 neurons, 15 fields of view from 7 mice) during presentation of visual stimuli after associative learning, grouped by preferred cue type. Vertical dashed lines demarcate visual stimulus onsets and offsets. Horizontal lines demarcate sorting of neurons by preferred cue (cue with the largest absolute value response). Grouping by preferred cue is also indicated by colored vertical bars to the right of the heatmap (green: RC; purple: AC-Av; black: NC).
i, Left: percentage of all neurons with significant cue responses (RC: 124/360 neurons; AC-Av: 39/360; NC: 46/360). Right: percentage of cue responsive BA neurons preferring (i.e., maximally responsive to) a given cue (RC: 121/138 neurons; AC-Av: 10/138; NC: 7/138).
j, RC vs. AC-Av cue response magnitude of activated neurons (n = 70 neurons).
k, Average timecourse of RC responses across activated BA neurons (hungry: dark red; sated: light red; n = 66 neurons) and suppressed BA neurons (hungry: dark blue; sated: light blue; n = 58 neurons). Error bars: s.e.m. across neurons. Z: Z-score.
l, Bars: mean RC response across hunger and satiety for activated (left, n = 66 neurons from 4 mice, *** p < 0.0001) and suppressed neurons (right, n = 58 neurons from 4 mice, *** p < 0.0001). Lines: individual cell responses. Error bars: s.e.m. across neurons. Two-sided Wilcoxon sign-rank.

