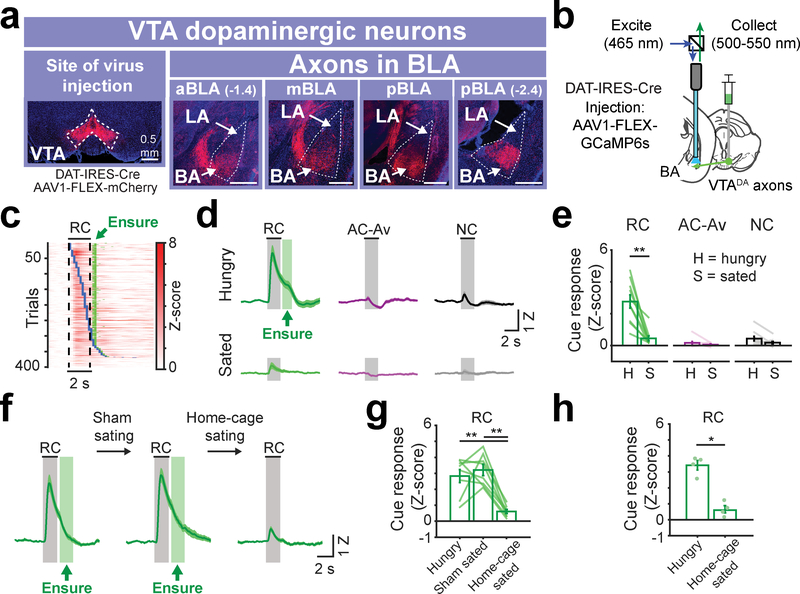
Fig. 2 |. VTA dopamine axons in BA are activated by cues predicting food reward availability in hungry mice.
a, Anterograde injection of AAV1-FLEX-mCherry in VTA of DAT-IRES-Cre mice. Within the BLA, VTA dopamine axons are strongly enriched in the basal amygdala (BA) vs. the lateral amygdala (LA). This was true in anterior, middle, as well as posterior BLA (aBLA, mBLA, and pBLA, respectively). Scale bar = 0.5 mm. Images are from a representative mouse (n = 4 replicate mice).
b, Schematic of fiber photometry recordings from VTA dopamine axons in BA.
c, Rows: all single-trial responses from 10 trained mice, sorted by onset of first lick following RC onset (blue ticks). Green ticks: time of Ensure delivery. Responses were locked to cue onset, not to motor response onset.
d, Mean VTADA➜BA cue responses in trained mice across hungry (top) and sated (bottom) states. The range of Ensure delivery times (min and max) is indicated by the green rectangle following cue offset. n = 10 mice. Error bars: s.e.m. across mice. Z: Z-score.
e, Comparison of cue response magnitudes across states (n = 10 mice, mean ± s.e.m. across mice, ** p = 0.002, two-sided Wilcoxon sign-rank). H: hungry; S: sated.
f, Mean VTADA➜BA RC responses in hungry, sham sated, and home-cage sated mice, respectively. n = 8 mice. Error bars: s.e.m. across mice.
g, Comparison of RC response magnitudes prior to and following sham satiation and following home-cage satiation (n = 8 mice, mean ± s.e.m. across mice, hungry vs. home-cage sated: ** p = 0.005, sham sated vs. home-cage sated: ** p = 0.001, Kruskal-Wallis, Bonferroni corrected post-hoc comparisons).
h, Comparison of RC response magnitudes following sham satiation in home cage (n = 4 mice) vs. satiation in home cage (n = 4 separate mice; mean ± s.e.m. across mice, * p = 0.02, two-sided Wilcoxon rank-sum).

