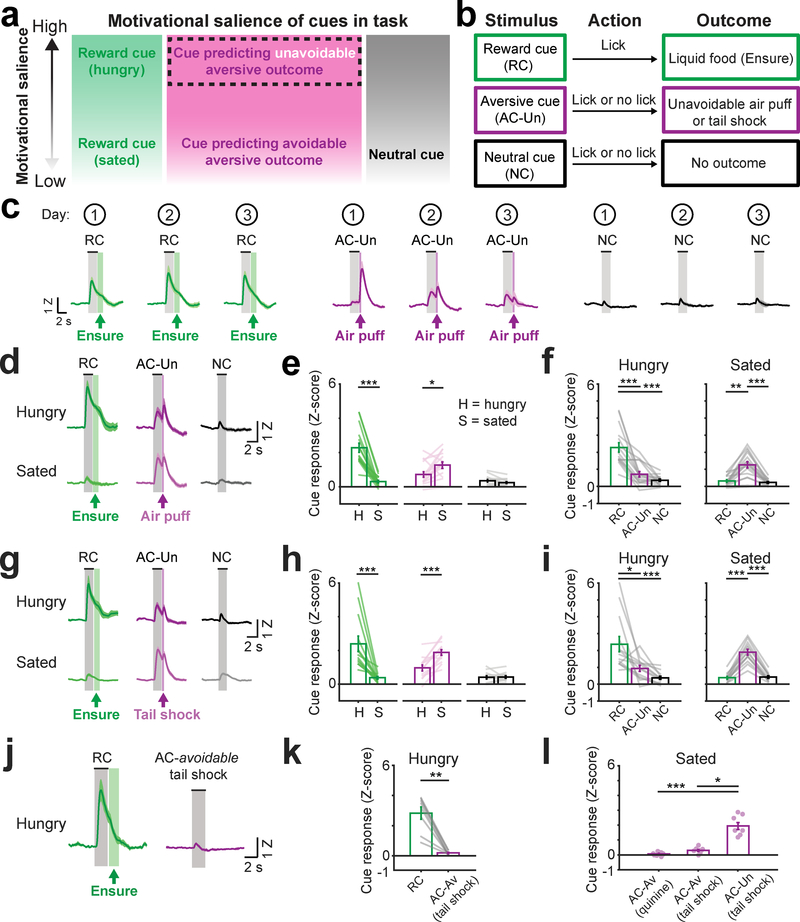
Fig. 3 |. VTA dopamine axons in BA are activated by cues predicting unavoidable aversive outcomes.
a, Diagram of relative motivational salience of each cue. We hypothesized that cues predicting unavoidable aversive outcomes would have higher motivational salience than cues predicting a passively avoidable aversive outcome or no outcome.
b, Modified task with aversive cue (AC-Un) predicting an unavoidable aversive outcome (air puff or tail shock).
c, Mean cue response timecourses of VTADA➜BA axons for each of the three first sessions (numbers within circles at top) following introduction of the AC-Un predicting unavoidable air puff delivery. Mice were previously trained on the task involving avoidable aversive cues (AC-Av). Error bars: s.e.m. across 10 mice. Z: Z-score.
d, Mean VTADA➜BA cue responses in hungry and sated mice (combined across Days 2 and 3 from c) following acquisition of responses to cues predicting unavoidable aversive air puff. n = 10 mice. Error bars: s.e.m. across 16 sessions.
e, Comparison of cue response magnitudes across states (mean ± s.e.m. across 16 sessions from 10 mice, RC hungry vs. sated: *** p = 0.0004, AC-Un hungry vs. sated: * p = 0.017, two-sided Wilcoxon sign-rank). H: hungry; S: sated.
f, Comparison of cue response magnitudes within hunger state and within sated state (same data as in e, n = 10 mice, mean ± s.e.m. across 16 sessions, RC vs. AC-Un during hunger state: *** p = 0.0008, RC vs. NC during hunger state: *** p < 0.0001, RC vs. AC-Un during sated state: ** p = 0.004, AC-Un vs. NC during sated state: *** p = 0.0005, Kruskal-Wallis, Bonferroni corrected post-hoc comparisons).
g, Mean VTADA➜BA cue responses in hungry and sated mice (combined across Days 2 and 3 following introduction of tail shocks) after acquisition of cues predicting unavoidable tail shock. n = 8 mice. Error bars: s.e.m. across 13 sessions.
h, Comparison of responses to the same cue across states (mean ± s.e.m. across 13 sessions from 8 mice, RC hungry vs. sated: *** p = 0.0002, AC-Un hungry vs. sated: *** p = 0.0002, two-sided Wilcoxon sign-rank).
i, Comparison of response magnitude within hunger state and within sated state (same data as in h, mean ± s.e.m. across 13 sessions from 8 mice, RC vs. AC-Un during hunger state: * p = 0.04, RC vs. NC during hunger state: *** p < 0.0001, RC vs. AC-Un during sated state: *** p < 0.0001, AC-Un vs. NC during sated state: *** p < 0.0001, Kruskal-Wallis, Bonferroni corrected post-hoc comparisons).
j, Mean VTADA➜BA cue responses following training on a task involving avoidable tail shock in hungry mice. Error bars: s.e.m. across 8 mice. Z: Z-score.
k, Comparison of cue response magnitudes following training on a task involving reward-predicting and avoidable tail shock-predicting cues (AC-Av tail shock). Mean ± s.e.m. across 8 mice, ** p = 0.007, two-sided Wilcoxon sign-rank.
l, Comparison of cue response magnitudes following training on a task involving either avoidable quinine (AC-Av quinine, n = 10 mice), avoidable tail shock (AC-Av tail shock, n = 8 mice), or unavoidable tail shock (AC-Un tail shock, n = 8 mice). Mean ± s.e.m., *** p < 0.0001, * p = 0.014, Kruskal-Wallis, Bonferroni corrected post-hoc comparisons

