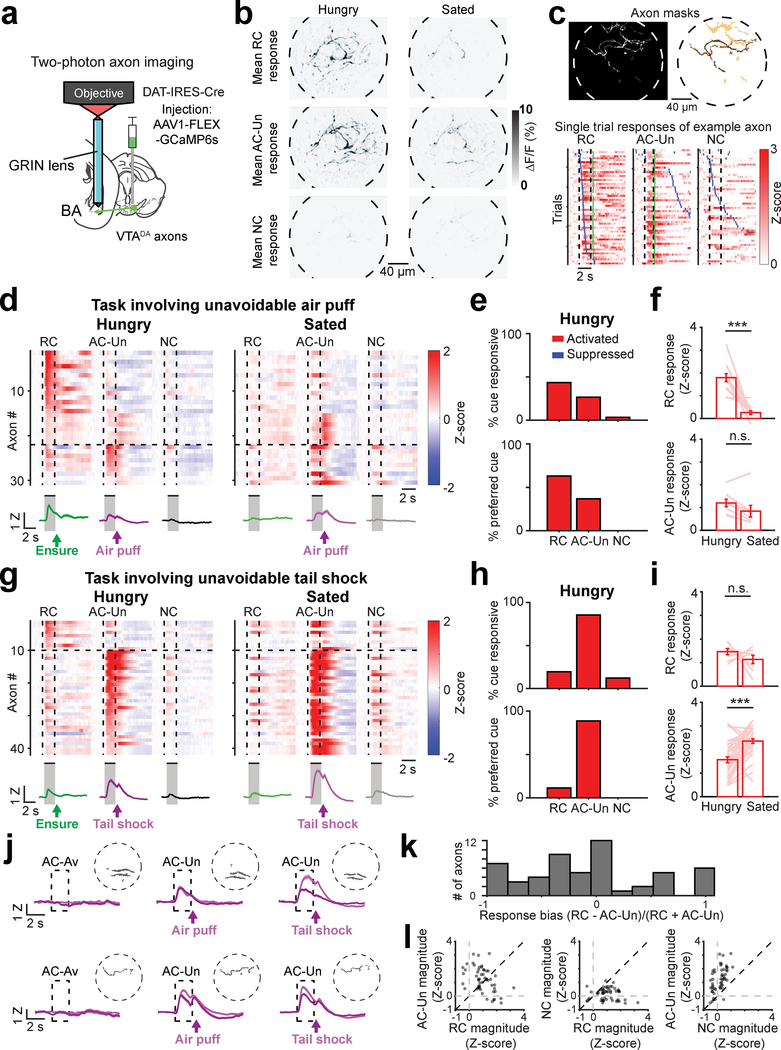
Fig. 5 |. Individual VTADA➜BA axons are activated by both cues predicting reward and cues predicting unavoidable aversive outcomes.
a, Schematic depicting two-photon calcium imaging of VTADA➜BA axons using a GRIN lens.
b, Mean cue-evoked responses (fractional change in GCaMP6s fluorescence, averaged across 2-s stimulus presentation) across a single session for an example field of view during hungry trials (left column) or sated trials (right column), from the task involving cues predicting unavoidable aversive air puff (AC-Un). Note that individual axons are activated by both RC and AC-Un, and that AC-Un responses in most axons persist during sated trials. Images are from a representative mouse (n = 4 replicate mice). See also Supplementary Movie 1.
c, Top left: maximum intensity projection across ICA-based weighted axon masks from an example field of view. Top right: masks for 3 responsive axons, thresholded and pseudocolored for visualization purposes. Bottom: Single-trial responses of an example VTADA➜BA axon following associative learning. This axon is responsive to both the reward cue (RC) and the aversive cue predicting unavoidable air puff (AC-Un). Rows: trials sorted by onset of first lick after visual stimulus onset (blue ticks). Green ticks: Ensure delivery during RC trials or air puff delivery during AC-Un trials.
d, Top: mean response of individual axons (rows) to presentation of the RC, AC-Un, and neutral cue (NC) (n = 30 axons, 6 fields of view from 4 mice). Bottom: mean cue response timecourse across all axons. Error bars: s.e.m. across axons. Z: Z-score. Data are from task in which AC-Un predicts air puff. Vertical dashed lines demarcate visual stimulus onsets and offsets. Horizontal lines demarcate sorting of axons by preferred cue (cue with the largest absolute value response).
e, Top: percent of all axons with significant cue responses (RC: 13/30 axons; AC-Un: 8/30; NC: 1/30). Bottom: percent of cue responsive axons preferring a given cue. All data from recordings during the hungry state.
f, Top: RC response magnitude for significantly activated axons. Lines: individual axon responses across hunger and satiety. Mean ± s.e.m., n = 13 axons, *** p = 0.0005. Bottom: AC-Un response for activated axons. Mean ± s.e.m., n = 8 axons, p = 0.078, n.s.: not significant, two-sided Wilcoxon sign-rank.
g, Top: mean cue responses of individual axons (rows) (n = 41 axons, 7 fields of view from 4 mice). Bottom: mean cue response timecourse across all axons. Error bars: s.e.m. across axons. Z: Z-score. Data are from task in which AC-Un predicts tail shock.
h, Top: percent of all axons with significant cue responses (RC: 8/41 axons; AC-Un: 35/41; NC: 5/41). Bottom: percent of cue responsive axons preferring a given cue.
i, Top: RC response for significantly activated axons. Lines: individual axon responses across hunger and satiety. Mean ± s.e.m., n = 8 axons, p = 0.46, n.s.: not significant. Bottom: mean AC-Un response for activated axons. Mean ± s.e.m., n = 35 axons, *** p < 0.0001, two-sided Wilcoxon sign-rank.
j, Mean response timecourses across aversive cue trials for two axons (recorded in separate mice) that were tracked across sessions spanning 18 days. Single-session timecourses are shown following training on successive versions of the task in which the same aversive cue predicted avoidable quinine, then unavoidable air puff, and then unavoidable tail shock. Traces from hungry runs (dark purple) and sated runs (light purple) are shown. Note that both axons were not responsive to AC-Av but then acquired responses to both the AC-Un paired with air puff and to the AC-Un paired with tail shock. Error bars: s.e.m. across trials (on average, 50 trials/session). Dashed circles: perimeter of field of view with ICA-based single-axon mask (thresholded).
k, Histogram of cue response bias of VTADA➜BA axons significantly activated by either the RC and/or the AC-Un. Note the number of axons with similar magnitude responses to both cues (i.e. values near zero).
l, Scatter plot of magnitudes (from n = 54 significantly responsive axons) of RC vs. AC-Un responses (left; Pearson’s r: −0.46, p = 0.0004), RC vs. NC responses (middle; not significantly correlated, r: −0.07, p = 0.61), and NC vs. AC-Un responses (right; Pearson’s r: 0.56, p < 0.0001). Data in k and l were combined across tasks involving air puff (d) and tail shock (g).

