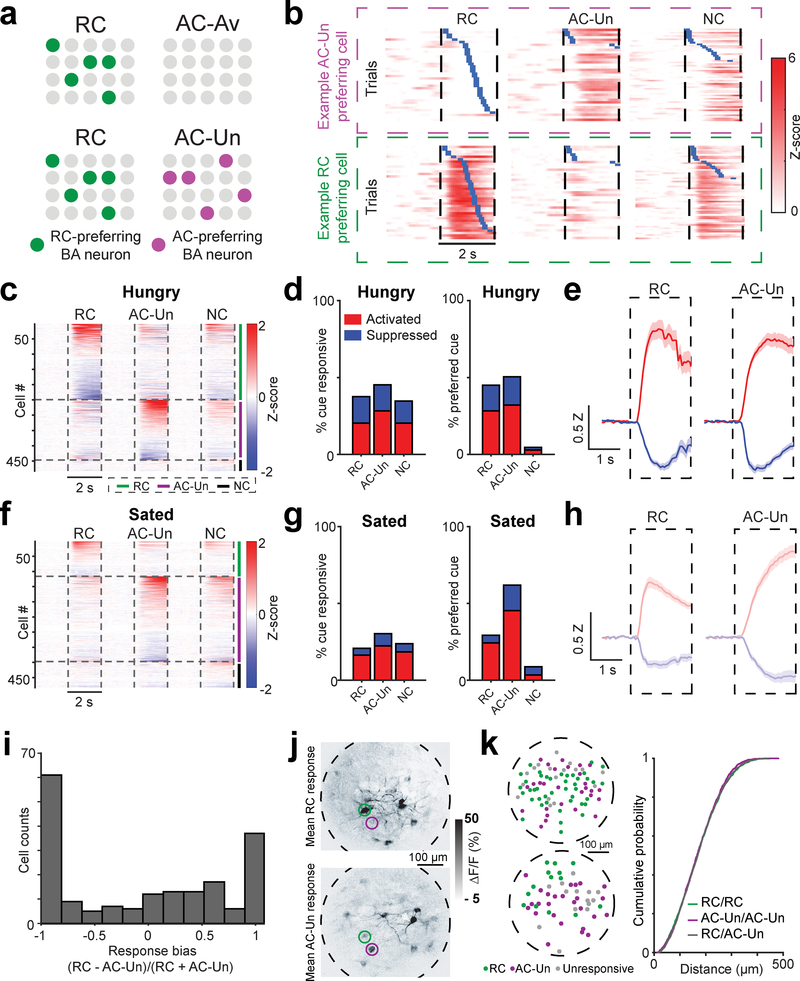
Fig. 6 |. Distinct, intermingled BA neurons acquire responses to cues predicting either reward or unavoidable aversive outcomes.
a, Top row: schematic depicting results from Fig. 1, in which certain basal amygdala (BA) excitatory neurons became responsive to the RC (left) but not to the aversive cue predicting passively avoidable quinine outcome (AC-Av, right). Bottom row: for the modified task involving cues predicting unavoidable aversive outcomes (AC-Un, right) as well as an RC (left), we asked whether certain BA neurons responded mainly to the RC (green), to the AC-Un (purple), or to both.
b, Example BA neurons that are preferentially activated by either the AC-Un (top) or the RC (bottom). Trials are sorted by the onset of licking (blue ticks). Vertical dashed lines demarcate visual stimulus onsets and offsets.
c, Heatmap showing mean cue response timecourses of all recorded BA neurons (rows) during hungry sessions, sorted by response magnitude and clustered by preferred cue (n = 482 neurons, 9 fields of view from 4 mice), for the task involving unavoidable tail shock. Vertical dashed lines demarcate visual stimulus onsets and offsets. Horizontal lines demarcate sorting of axons by preferred cue.
d, Left: percent of BA neurons with significant cue responses during recordings in hungry mice (RC: 181/482 neurons; AC-Un: 218/482; NC: 167/482). Right: percent of cue responsive BA neurons preferring a given cue (RC: 129/287 neurons; AC-Un: 145/287; NC: 13/287).
e, Response timecourses across neurons that were significantly activated (red) or suppressed (blue) by the RC (n = 98 activated neurons; n = 83 suppressed neurons) or the AC-Un (n = 136 activated neurons; n = 82 suppressed neurons) during hungry sessions. Mean ± s.e.m. Z: Z-score.
f, Heatmap showing mean cue response timecourses of all recorded BA neurons (rows) during sated sessions, sorted by response magnitude and clustered by preferred cue (n = 482 neurons, 9 fields of view from 4 mice), for the task involving unavoidable tail shock.
g, Left: percent of BA neurons with significant cue responses during recordings in sated mice (RC: 100/482 neurons; AC-Un: 146/482; NC: 115/482). Right: percent of cue responsive BA neurons preferring a given cue (RC: 60/205 neurons; AC-Un: 127/205; NC: 18/205).
h, Response timecourses across neurons that were significantly activated (red) or suppressed (blue) by the RC (n = 79 activated neurons; n = 21 suppressed neurons) or the AC-Un (n = 108 activated neurons; n = 38 suppressed neurons) during sated sessions. Mean ± s.e.m. Z: Z-score.
i, Response bias of neurons activated by RC and/or AC-Un. Note the paucity of neurons with equal response magnitudes to both cues (i.e. bias value near zero) as compared to VTADA➜BA axons (Fig. 5k).
j, Mean cue-evoked responses (fractional change in GCaMP6s fluorescence) across a single session for an example field of view. Images are from a representative mouse (n = 4 replicate mice). Top: RC response. Bottom: AC-Un response. Even neighboring neurons could show selective responses to the AC-Un (purple circle) or to the RC (green circle).
k, Left: two example fields of view showing centroids of BA neurons (green: RC responsive, purple: AC-Un responsive; gray: unresponsive). Right: cumulative probability distributions show that distances between neurons preferring the same cue (i.e. both preferring RC, ‘RC/RC’, or both preferring AC-Un, ‘AC-Un/AC-Un’) were not different than neurons preferring opposite cue types (RC/AC-Un) (n = 129 RC preferring neurons, n = 145 AC-Un preferring neurons, two-sided Komolgorov-Smirnov test). Note that, given the higher resolution of two-photon imaging compared to one-photon imaging, we have high confidence in the estimated distances between cells and in the lack of cross-contamination of signals from nearby cells.

