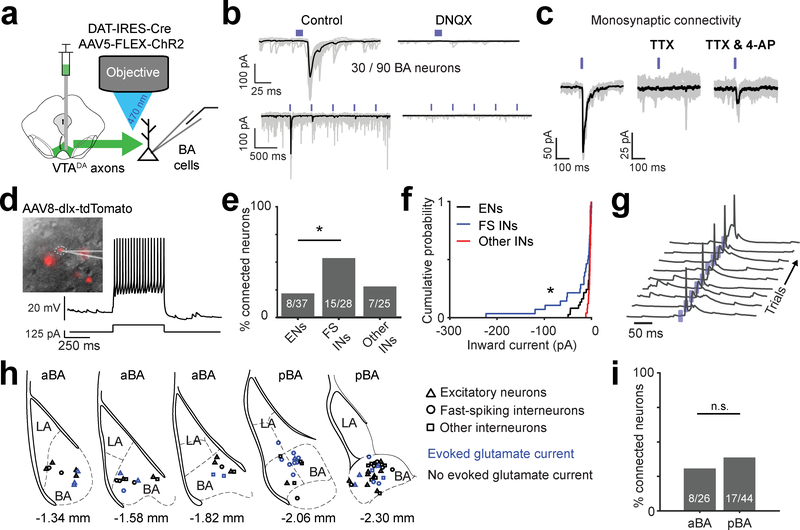
Fig. 7 |. VTADA➜BA axons release glutamate.
a, Schematic of Channelrhodopsin2 (ChR2)-assisted circuit mapping of connectivity between VTA dopaminergic axons and BA neurons.
b, Top left: example recording of ChR2-evoked inward synaptic current (−70 mV holding potential). Bottom left: repeated stimulation at 2 Hz resulted in strong short-term depression. Right: evoked inward currents were blocked by a glutamate receptor antagonist (DNQX, 10 μM). Mean response in black on top of the 30 single trials shown in gray.
c, Example experiment confirming monosynaptic connectivity by blocking action potentials with a voltage-gated sodium channel blocker, tetrodotoxin (TTX; 1 μM), followed by addition of a potassium channel blocker, 4-aminopyridine (4-AP; 100 μM), to restore evoked synaptic release. Mean response in black on top of the 30 single trials shown in gray.
d, Identification of inhibitory interneurons using a viral strategy involving infection with AAV8-dlx-tdTomato (see Methods) and electrophysiological characterization. Left: dlx-tdTomato positive neuron. Right: current clamp recording with somatic current injection (125 pA) in a typical fast-spiking interneuron. Result is representative of the 28 fast-spiking putative inhibitory interneurons (FS INs) recorded.
e, Percentage of connected neurons, separated by neuronal class. FS INs were more likely than excitatory neurons (ENs) or other non-fast spiking interneurons (other INs) to evoke glutamatergic currents (n = 90 neurons from 10 mice, * p = 0.011, one-sided binomial proportion test, Bonferroni corrected).
f, Cumulative probability distributions show that VTADA➜BA axon-evoked glutamatergic currents were larger in FS INs (n = 28 cells) than in ENs (n = 37 cells, * p = 0.03) or other INs (n = 25 cells, * p = 0.01). Two-sided Komolgorov-Smirnov test, Bonferroni corrected for multiple comparisons.
g, ChR2-evoked synaptic potentials were sufficient to trigger somatic action potentials in FS INs. Traces: consecutive single trials. Blue ticks: blue light pulses. Similar results were observed in 5 other FS INs.
h, Locations of recorded neurons for which we had low magnification images of recording pipette location (70/90 neurons). Neuronal class markers: ENs, triangles; FS INs, circles; other INs, squares. Blue: neurons with light-evoked glutamatergic currents. Sections used for comparison of anterior BA (aBA) and posterior BA (pBA) in panel i are indicated. Location relative to Bregma based on Paxinos and Franklin’s mouse atlas (4th edition) is indicated below each section.
i, Percentage of connected neurons, separated by aBA vs. pBA. (n = 70 neurons for which we had anatomical location from 10 mice, n.s. = not significant, one-sided binomial proportion test).

