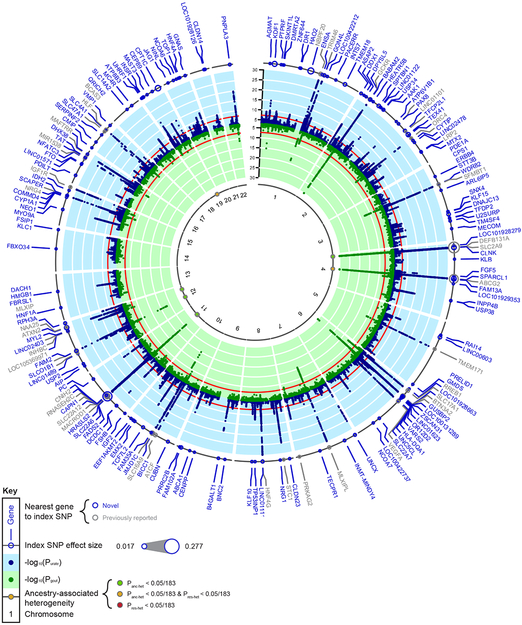
Figure 1 ∣. Trans-ethnic GWAS meta-analysis identifies 183 loci associated with serum urate.
Outer ring: Dot size represents the genetic effect size of the index SNP at each labeled locus on serum urate. Blue band: −log10(two-sided meta-analysis P-value) for association with serum urate (n = 457,690), by chromosomal position (GRCh37 (hg19) reference build). Red line indicates genome-wide significance (P = 5 × 10⁻⁸). Blue gene labels indicate novel loci, gray labels loci reported in previous GWAS of serum urate. Green band: −log10(two-sided meta-analysis P-value) for association with gout (n = 763,813), by chromosomal position. Red line indicates genome-wide significance (P = 5 × 10⁻⁸). Inner band: Dots represent index SNPs with significant heterogeneity and are color-coded according to its source: green for ancestry-related heterogeneity (Panc-het < 2.7 × 10⁻⁴ (0.05/183)), red for residual heterogeneity (Pres-het < 2.7 × 10⁻⁴), and yellow for both (Panc-het and Pres-het < 2.7 × 10⁻⁴). Loci are labeled with the gene closest to the index SNP. Panc-het and Pres-het were generated by MR-MEGA (Methods).

