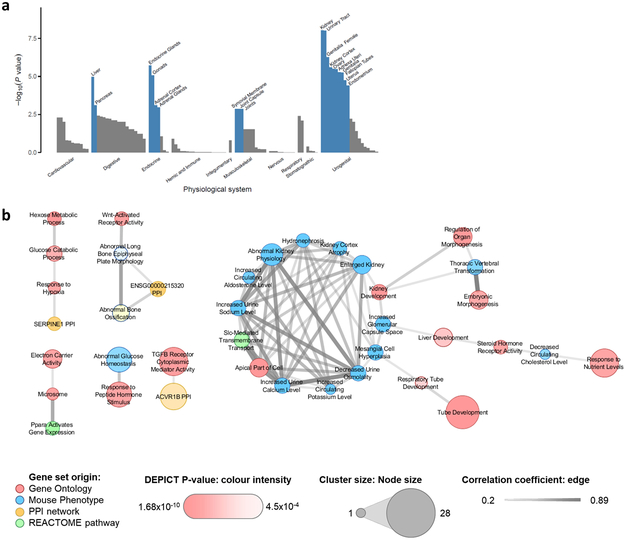
Figure 4 ∣. Genes expressed in urate-associated loci are enriched in kidney tissue and pathways.
a, Grouped physiological systems (x-axis) that were tested individually for enrichment of expression of genes in urate-associated loci among European-ancestry individuals (n = 288,649) using DEPICT are shown as a bar plot, with the −log10(enrichment P-value) on the y-axis. Significantly enriched systems are labeled and highlighted in blue (enrichment false discovery rate (FDR) < 0.01). b, Correlated (r > 0.2) meta-gene sets that were strongly enriched (enrichment FDR < 0.01) for genes mapping into urate-associated loci among European-ancestry individuals (n = 288,649). Thickness of the edges represents the magnitude of the correlation coefficient, node size, color and intensity represent the number of clustered gene sets, gene set origin, and enrichment P-value, respectively.

