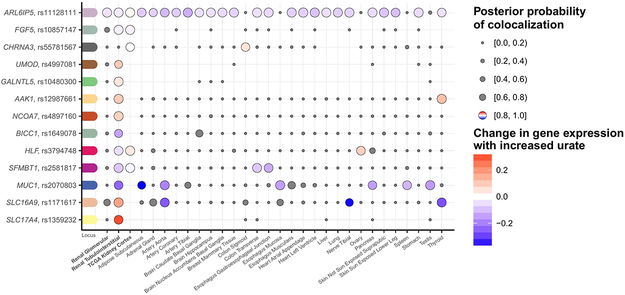
Figure 6 ∣. Co-localization of urate-association signals with gene expression in cis in kidney tissues.
Serum urate association signals identified among European ancestry individuals (n = 288,649) were tested for co-localization with all eQTLs where the eQTL cis-window overlapped (±100 kb) the index SNP. Genes with ≥1 positive co-localization (posterior probability of one common causal variant, H4, ≥ 0.80) in a kidney tissue are illustrated with the respective index SNP and transcript (y-axis). Co-localizations across all tissues (x-axis) are illustrated as dots, where the size of the dots indicates the posterior probability of the co-localization. Negative co-localizations (posterior probability of H4 < 0.80) are marked in gray, while the positive co-localizations are color-coded relative to the change in expression with a color gradient as indicated in the legend.

