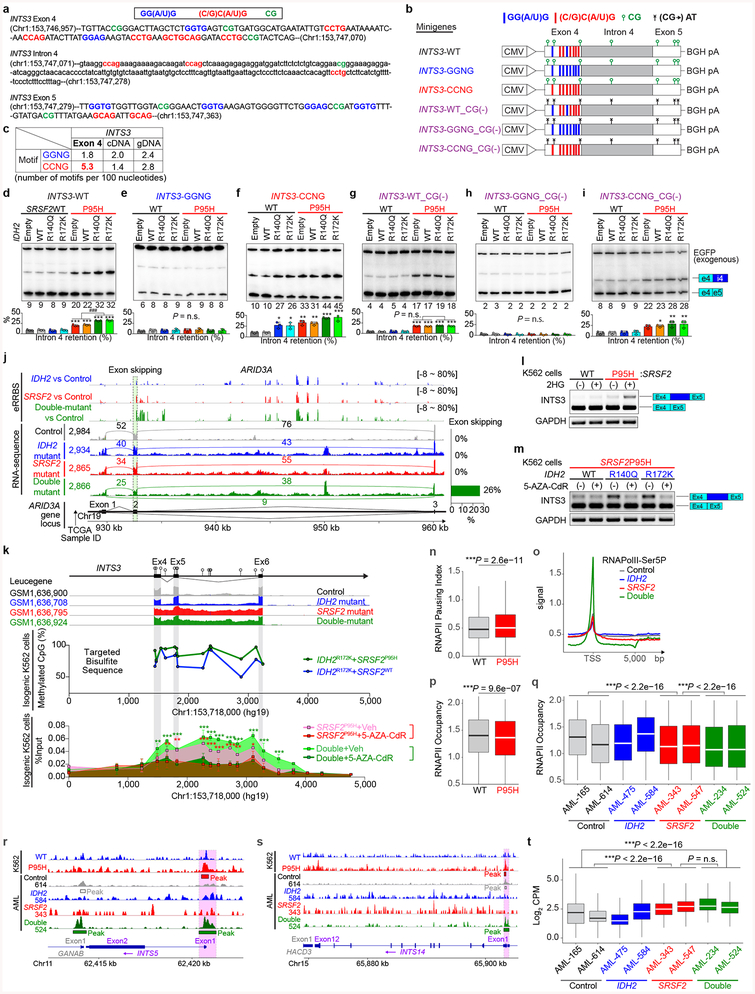
Extended Data Fig. 7 |. DNA hypermethylation at INTS3 enhances INTS3 mis-splicing, which is associated with RNA polymerase II (RNAPII) stalling.
a, Sequence of human INTS3 exon 4, intron 4 and exon 5, and schematic of INTS3 minigene constructs. GG(A/U)G motifs, (C/G)C(A/U)G motifs, and CG dinucleotides are highlighted in blue, red, and green, respectively. b, Schematic of INTS3 minigene constructs. c, Table revealing the number of GGNG or CCNG motifs in exon 4, entire cDNA of INTS3, or entire genomic DNA (gDNA) of INTS3 per 100 nucleotides. d-i, Radioactive RT-PCR results of INTS3 minigene assays using indicated versions of the minigene in isogenic K562 cells. Percentage of intron 4 retention were normalized against exogenous EGFP (n = 3; the mean percentage ± s.d.; one-way ANOVA with Tukey’s multiple comparison test). j, Mean percentage of methylated CpGs at ARID3A in AML patient samples with indicated genotypes determined by enhanced reduced representation bisulfite sequence (eRRBS) (n = 3 patients per genotype), followed by IGV plots of RNA-seq data of ARID3A from the TCGA. k, Results of targeted bisulfite sequence (n = 1 per genotype) and RNAPII-Ser2P ChIP-walking experiments are represented as shown in Fig. 3f (n = 3; the mean percentage ± s.d.; two-way ANOVA with Tukey’s multiple comparison test). l, m, RT-PCR results detecting INTS3 intron retention in isogenic K562 cells harboring various combinations of IDH2 and SRSF2 mutations that were treated with cell-permeable 2HG at 0.5 μM (l) or 5-AZA-CdR at 5 μM (m) for 8 days (representative results from three biologically independent experiments with similar results). n, RNAII pausing index in isogenic SRSF2WT or SRSF2P95H mutant K562 cells was calculated as previously described20 as a ratio of normalized ChIP-Seq reads of RNAPII-Ser5P on TSSs (+/− 250 bp) over that of the corresponding bodies (+500 to +1000 from TSSs) (the median value is represented by the line inside the box and the box expands from the 25th to 75th percentiles with whiskers drawn down to the 2.5 and 97.5 percentiles; each box plot was made by analyzing ChIP-seq data from one cell line; two-sided Student’s t-test). o, Metagene plots showing genome-wide RNAPII-Ser5P occupancy in primary AML patient samples with indicated genotypes (TSS: transcription start site; patient samples used for this analysis are described in Supplementary Table 23). p, q, RNAPII occupancy representing ChIP-Seq reads of RNAPII-Ser2P over gene bodies was calculated for isogenic K562 cells (p) and AML samples (q) (the median value is represented by the line inside the box and the box expands from the 25th to 75th percentiles with whiskers drawn down to the 2.5 and 97.5 percentiles; each box plot was made by analyzing ChIP-seq data from one cell line (p) or one primary AML sample (q); two-sided Student’s t-test (p) and one-way ANOVA with Tukey’s multiple comparison test (q)). r, s, Genome browser view of ChIP-seq signal for RNAPII-Ser5P at INTS5 (r) and INTS14 (s) in isogenic K562 cells with or without SRSF2 mutation (n = 1) and primary AML samples with indicated genotype (results generated from n = 2 primary AML samples are shown). t, RNAPII abundance over the differentially spliced regions between IDH2/SRSF2 wild-type control and SRSF2 single-mutant AML determined by RNAPII-Ser2P ChIP-seq (y-axis: Log2 (Counts per million); the median value is represented by the line inside the box and the box expands from the 25th to 75th percentiles with whiskers drawn down to the 2.5 and 97.5 percentiles; each box plot was made by analyzing ChIP-seq data from one primary AML sample; one-way ANOVA with Tukey’s multiple comparison test). *P < 0.05; **P < 0.01; ***P < 0.001.

