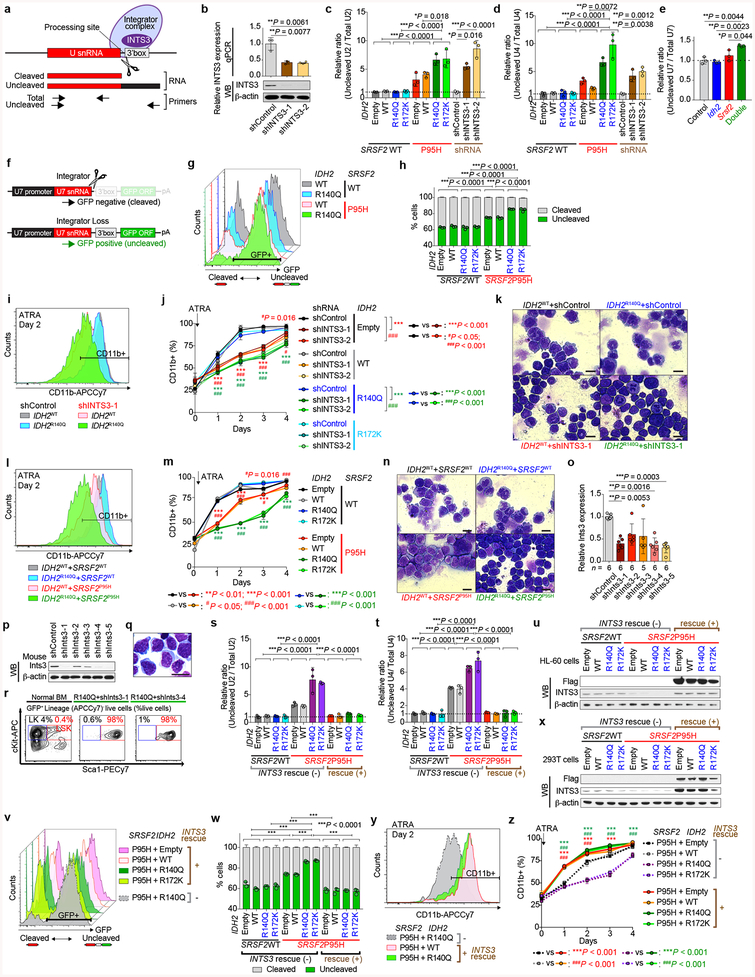
Extended Data Fig. 8 |. Loss of INTS3 impairs uridine-rich small nuclear RNA (snRNAs) processing and blocks myeloid differentiation.
a, Schematic of snRNA processing site and qPCR primers for detecting cleaved or uncleaved snRNA. b, qPCR (top; n = 3; the mean ± s.d.; a two-sided Student’s t-test) and representative WB of INTS3 in HL-60 cells transduced with short-hairpin RNAs (shRNAs) targeting human INTS3 (bottom; representative results from three biologically independent experiments). c-e, s, t, qPCR results of U2 (c, s) and U4 (d, t) snRNAs in isogenic HL-60 cells and U7 snRNA in murine cells from Extended Data Fig. 6n (e). Ratio of uncleaved/total snRNAs expression was compared (n = 3, the mean ratio ± s.d.; one-way ANOVA with Tukey’s multiple comparison test; the largest P-values calculated among 2 × 2 comparisons of two components from different groups are shown. For example, P-values were calculated from the following four comparisons; bars 1 vs 3, 2 vs 3, 1 vs 4, 2 vs 4). f, Schematic of the U7 snRNA-GFP reporter. g, v, Flow cytometry analysis of 293T cells transduced with U7 snRNA-GFP reporter and IDH2/SRSF2/INTS3 constructs as labeled on the right (representative results from three biologically independent experiments are shown). h, w, Quantification of % GFP− and GFP+ 293T cells (n = 3 biologically independent experiments, the mean percentage ± s.d.; one-way ANOVA with Tukey’s multiple comparison test; P-values are shown as in c). i, l, y, Flow cytometry analysis of CD11b expression in isogenic HL-60 cells after ATRA treatment for two days (representative results from three biologically independent experiments are shown). j, m, z, Quantification of percentages of CD11b+ HL-60 cells over time (n = 3; the mean percentage ± s.d.; two-way ANOVA with Tukey’s multiple comparison test). k, n, Cytomorphology of isogenic HL-60 cells after ATRA treatment for two days (Giemsa staining; scale bar, 10 μm; original magnification × 400; representative results from three biologically independent experiments are shown). o, p, qPCR (o) (the mean ± s.d.; Kruskal-Wallis tests with uncorrected Dunn’s test) and WB (p) of Ints3 in Ba/F3 cells transduced with shRNAs targeting mouse Ints3. q, r, Representative cytomorphology (q) and immunophenotype (r) of colony cells at the 6th colony. Normal BMMNCs were used as a control (the percentage listed represent the percent of cells within live cells; representative results from three biologically independent experiments are shown). u, x, WB of proteins extracted from HL-60 cells (u) assayed in s-t and y-z and 293T cells (x) assayed in v-w (representative results from three biologically independent experiments). *P < 0.05; **P < 0.01; ***P < 0.001; #P < 0.05; ##P < 0.01; ###P < 0.001.

