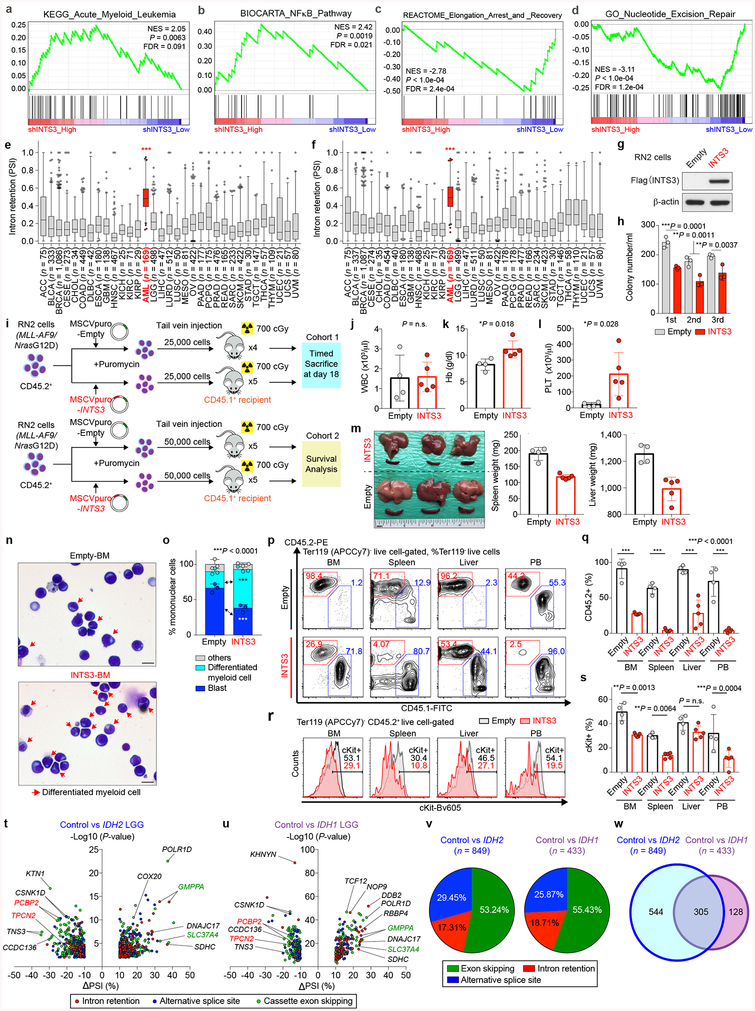
Extended Data Fig. 10 |. Gene expression and biological consequences of INTS3 loss and impact of IDH1/2 mutations on splicing in low-grade glioma.
a-d, Gene set enrichment analysis (GSEA) based on RNA-seq data generated from isogenic IDH2R140Q mutant HL-60 cells with or without INTS3 depletion. Representative results from gene sets associated with leukemogenesis and myeloid differentiation (a), oncogenic signaling pathways (b), RNAPII elongation-linked transcription (c), and DNA damage response (d) with statistical significance (P < 0.01) are shown (y-axis; Enrichment score; NES: Normalized enrichment score; FDR: False discovery rate; RNA-seq data generated from isogenic HL-60 cells in duplicate were analyzed using GSEA34). e, f, PSI values for INTS3 intron 4 (e) and 5 (f) retention events across 33 cancer cell types (the same datasets were analyzed in Fig. 4f; ACC: adrenocortical carcinoma, BLCA: bladder urothelial carcinoma, BRCA: breast invasive carcinoma, CESC: cervical squamous cell carcinoma and endocervical adenocarcinoma, CHOL: cholangiocarcinoma, DLBC: diffuse large B-cell lymphoma, ESCA: esophageal carcinoma, GBM: glioblastoma mutiforme, HNSC: head and neck squamous cell carcinoma, KICH: kidney chromophobe, KIRC: kidney renal clear cell carcinoma, KIRP: kidney renal papillary cell carcinoma, LGG: low-grade glioma, LIHC: liver hepatocellular carcinoma, LUSC: lung squamous cell carcinoma, MESO: mesothelioma, OV: ovarian serous cystadenocarcinoma, PRAD: prostate adenocarcinoma, READ: rectum adenocarcinoma, SARC: sarcoma, SKCM: skin cutaneous melanoma, STAD: stomach adenocarcinoma, TGCT: testicular germ cell tumors, THCA: thyroid carcinoma, THYM: thymoma, UCEC: uterine corpus endometrial carcinoma, UCS: uterine carcinosarcoma, UVM: uveal melanoma; the median value is represented by the line inside the box and the box expands from the 25th to 75th percentiles with whiskers drawn down to the 2.5 and 97.5 percentiles; samples below 2.5 percentile and above 97.5 percentile are shown as plots; one-way ANOVA with Dunnett’s multiple comparison test; ***P < 0.001 represents the P-values from all the comparisons between AML and any of other 32 non-AML cancer type). g, WB analysis confirming overexpression of 3× Flag-tagged INTS3 in RN2 (MLL-AF9/NrasG12D) leukemia cells (representative results from three biologically independent experiments). h, Colony numbers from serial replating assays of RN2 cells with or without INTS3 overexpression (n = 3; the mean + s.d. represented by lines above the box; two-way ANOVA with Sidak’s multiple comparison test). i, Schematic of INTS3 retroviral BM transplantation models where recipient mice from Cohort 1 were sacrificed at day 18 post-transplant and mice from Cohort 2 were observed for survival analysis until end-stage. j-l, Blood counts (WBC (j); Hb (k); PLT (l)) of mice from Cohort 1 at day 18 post-transplant (the mean ± s.d.; n = 4 (“Empty” group); n = 5 (“INTS3” group) recipient mice; a two-sided Student’s t-test). m, Representative photograph of spleens and livers from Cohort 1 with an inch scale (left), and spleen (middle) and liver weight (right) (n = 4 (Empty); n = 5 (INTS3); the mean ± s.d.; two-sided Student’s t-test). n, o, Representative Giemsa staining (n) (red arrows represent differentiated cells; scale bar, 10 μm; original magnification × 400) and percentages of blasts, differentiated myeloid cells, and other cells in BMMNCs (o) from moribund mice from Cohort 2 (n = 3 per genotype; 100 cells per mouse were classified; the mean percentage + s.d.; two-way ANOVA with Sidak’s multiple comparison test). p, q, Representative flow cytometry analysis of BM, spleen, liver, and PB (p) and percentages of CD45.2+ cells in Ter119− live cells (q) in recipient from Cohort 1 (n = 4 (Empty); n = 5 (INTS3); the mean ± s.d.; two-way ANOVA with Tukey’s multiple comparison test). r, s, Representative flow cytometry analysis showing cKit expression in RN2 cells with or without INTS3 overexpression (r) and quantification of cKit+ cells (s) from Cohort 1 (n = 4 (Empty); n = 5 (INTS3); the mean ± s.d.; one-way ANOVA with Tukey’s multiple comparison test). t, u, Volcano plots of aberrant splicing events in the LGG TCGA dataset based on IDH2 (t) or IDH1 (u) mutant genotypes. |ΔPSI| > 10% and P < 0.01 were used as thresholds (n = 849 and n = 433 differentially spliced events, respectively; RNA-seq data were analyzed using PSI-Sigma). v, Percentage of each class of alternative splicing event in IDH2 (left) and IDH1 (right) mutant LGG is shown in pie-chart. w, Venn diagram of numbers of alternatively spliced events from the LGG TCGA dataset based on IDH1/IDH2 mutant genotypes. “Control” represents LGG with wild-type IDH1 and IDH2. *P < 0.05; **P < 0.01; ***P < 0.001.

