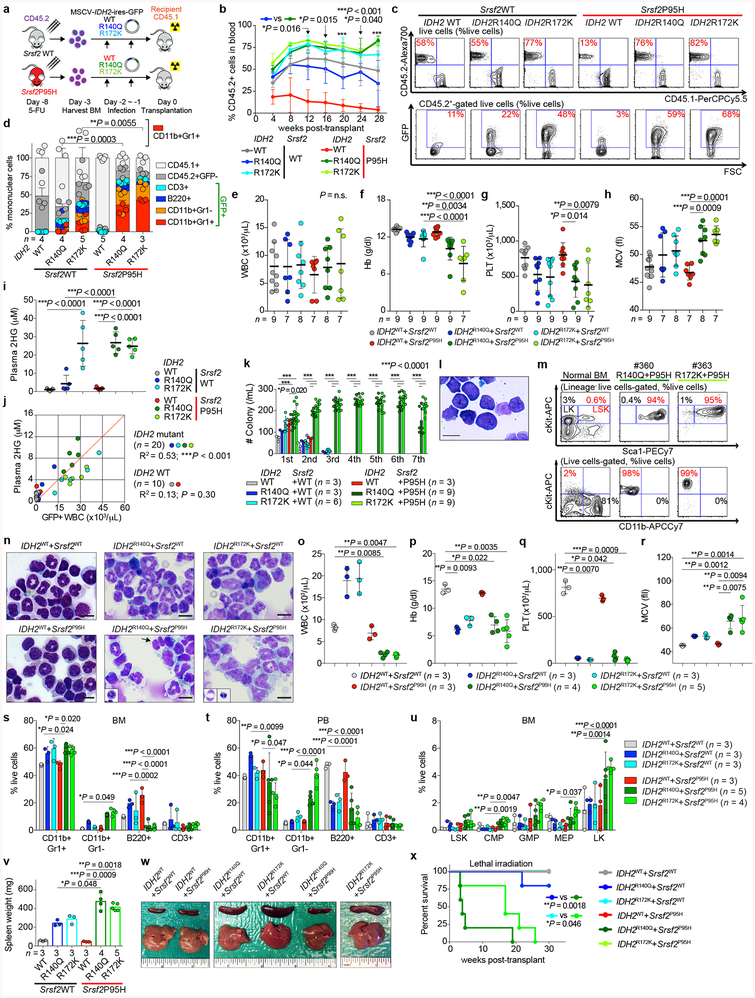
Extended Data Fig. 3 |. Mutant IDH2 cooperates with mutant Srsf2 to generate lethal MDS with proliferative features in vivo.
a, Schematic of bone marrow (BM) transplantation model. b, c, Chimerism of CD45.2+ cells in the peripheral blood (PB) of recipient mice over time (b) (n = 5 per group at 4 weeks; the mean percentage ± s.d.; two-way ANOVA with Tukey’s multiple comparison test) and representative flow cytometry data showing the chimerism of CD45.2+ vs CD45.1+ (top) or GFP+ (bottom) cells in PB at 16 weeks post-transplant (c) (representative results from five recipient mice; the percentages listed represent the percent of cells within live cells). d, Composition of PB mononuclear cells (PBMNCs) at 28 weeks post-transplant (the number of analyzed animals is indicated; the mean + s.d.; two-way ANOVA with Tukey’s multiple comparison tests statistical significances were detected in % of CD11b+Gr1+ cells in IDH2R140Q + Srsf2WT vs IDH2R140Q + Srsf2P95H and in IDH2R172K + Srsf2WT vs IDH2R172K + Srsf2P95H). e-h, Blood counts at 20 weeks post-transplant (WBC (e); Hb (f); PLT (g); MCV, mean corpuscular volume (h); the number of analyzed animals is indicated; the mean ± s.d.; one-way ANOVA with Tukey’s multiple comparison tests. i, Plasma 2HG levels at 20 weeks post-transplant (2HG levels were quantified as described40; n = 5 per group were randomly selected; the mean ± s.d.; one-way ANOVA with Tukey’s multiple comparison test). j, Correlations between plasma 2HG levels and number of GFP+ cells in peripheral blood at 24 weeks post-transplant (n = 5 per group; the Pearson correlation coefficient (R2) and P-values (two-tailed) were calculated using PRISM 7). k, Colony numbers from serial replating assays of BM cells harvested from end-stage mice from Fig. 2b are shown (the mean value ± s.d. represented by lines above the box; the number of analyzed animals is indicated; two-way ANOVA with Tukey’s multiple comparison test). l, Giemsa staining of IDH2R140Q + Srsf2P95H double-mutant cells from the 6th plating (scale bar, 10 μm; original magnification × 400; representative result from nine biologically independent experiments). m, Immunophenotype of colony cells at the 6th plating. Normal BM cells were used as a control (the percentage listed represent the percent of cells within live cells; representative result from nine recipient mice). n, Cytomorphology of BM mononuclear cells (BMMNCs) from recipient mice at end-stage. BM cells from IDH2 single-mutant and IDH2/Srsf2 double-mutant groups have increased granulocytes. In addition, IDH2/Srsf2 double-mutant groups had proliferation of monoblastic and monocytic cells as well as dysplastic features such as abnormally segmented neutrophils (black arrow and inset) and binucleated erythroid precursors with irregular nuclear contours (insets) (scale bar, 10 μm; original magnification × 400; representative results from three controls and nine recipients are shown; number of animals indicated in o-r). o-r, Blood counts at end-stage (WBC (o); Hb (p); PLT (q); MCV (r); the number of analyzed animals is indicated; the mean ± s.d.; Kruskal-Wallis tests with uncorrected Dunn’s test). s-u, Results from flow cytometry analysis of BM (s) and PB (t) mature lineages as well as BM hematopoietic stem/progenitor cells (HSPC) from two tibias, two femurs, and two pelvic bones (u) are quantified (LSK: Lineage−Sca1+cKit+; LT-HSC: long-term hematopoietic stem cell; ST-HSC: short-term HSC; MPP: multi-potent progenitor; LK: Lineage−Sca1−cKit+; CMP: common myeloid progenitor; GMP: granulocyte-monocyte progenitor; MEP: megakaryocyte-erythroid progenitor; the number of analyzed animals is indicated; the mean + s.d. is represented; two-way ANOVA with Tukey’s multiple comparison test). v, w, Spleen weight at end-stage (the number of analyzed animals is indicated; the mean ± s.d.; two-way ANOVA with Tukey’s multiple comparison test) (v) and representative photographs of spleens from recipient mice from v (w) (each photograph was taken with an inch ruler). x, Kaplan-Meier survival analysis of serially transplanted recipient mice that were lethally irradiated (n = 5 per group; Log-rank (Mantel-Cox) test (two-sided)). *P < 0.05; **P < 0.01; ***P < 0.001.

