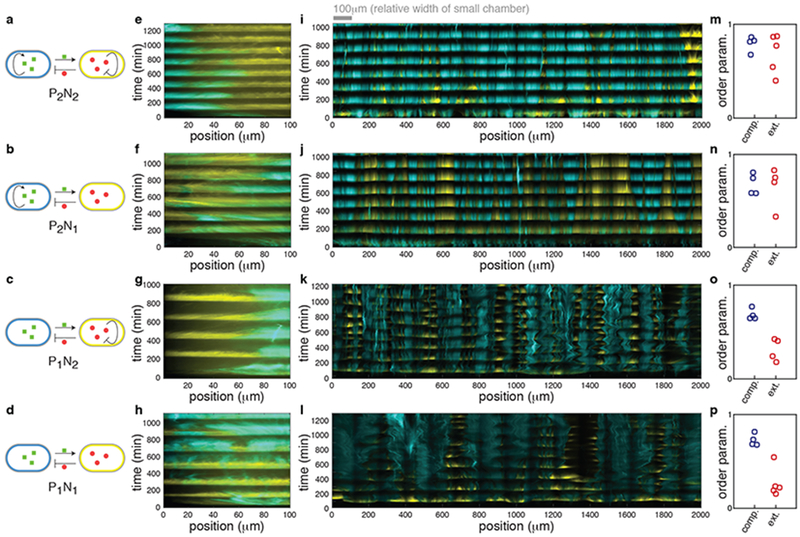
Figure 2.
Comparison of the dynamics of different circuit topologies in the compact and extended microfluidic devices. (a-d) Simplified circuit diagram of the P2N2, P2N1, P1N2 and P1N1 architectures. (e-l) Representative kymographs of four architectures in the compact hallway chamber (e-h) and in the extended open chamber (i-l) (n=4 independent experiments for each of these except (i) and (l) for which n=5). The kymographs of (e-h) were obtained by reanalyzing data from our previous work3 where the compact hallway chamber was used13. We observed similar behavior in a compact open chamber (Supplementary Fig. 3m). See Supplementary Fig. 2 for an explanation of kymograph construction. (m-p) Experimentally measured order parameters for each experiment in the compact (blue circles) and extended (red circles) chambers. The mean order parameter does not differ between architectures with and without positive feedback in the compact chamber (mean order parameters are 0.70 and 0.75 with and without positive feedback respectively, p=0.33, two-sided Welch’s t-test, n=8 independent experiments). However, in the extended chamber the mean order parameters are 0.29 and 0.69 for architectures with and without positive feedback, and this difference is significant (p = 2.3x10⁻⁴, two-sided Welch’s t-test, n=9 independent experiments).

