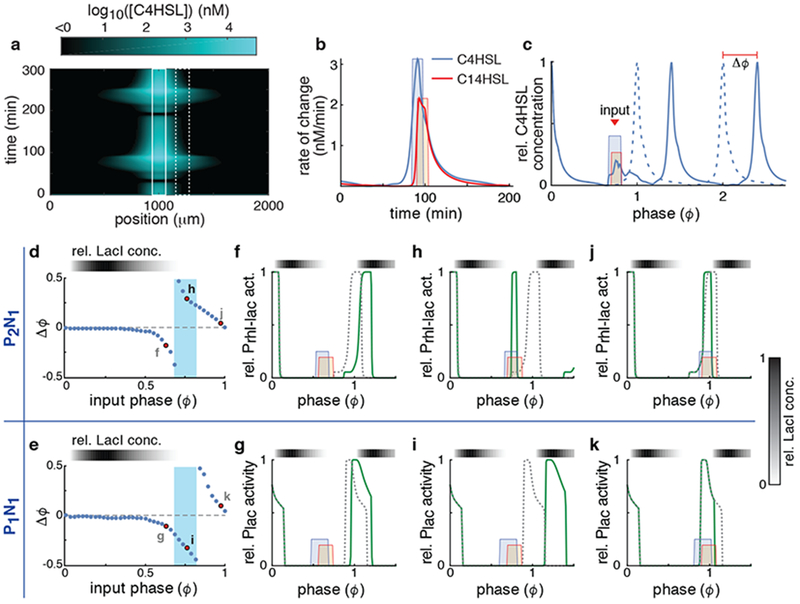
Figure 4.
Positive feedback changes the response to incoming signals. (a) Simulated concentration of C4HSL emitted from a single source in the middle of a trap (solid box) as a function of space and time (See Supplementary Fig. 4b for C14HSL). (b) Simulated rate of change of the two HSLs in a receiving population at 50 μm from their source (dashed box in (a)). Also shown are the square pulses we used as approximations of these incoming signals for further simulations. Shown are simulations obtained using the P2N2 architecture. Results are similar for other architectures (Supplementary Fig. 4). (c) Relative C4HSL concentration produced by the receiving population (dashed box in (a)) in the presence (solid curve) and absence (dashed curve) of the incoming signal (colored boxes). From these we estimated the phase shift (Δϕ) of the receiving population. Here ϕ=0 is defined as the phase at which the C4HSL concentration of the receiving population is at its maximum. (d-e) The change in the phase (Δϕ) of the receiving population as a function of the phase (ϕ) at which the driving signal pulse is received for the P2N1 (d) and P1N1 (e) architectures. The highlighted points refer to subsequent panels. (f-k) Relative transcriptional activity (solid green curve) of the Prhl-lac promoter of the P2N1 (top) and Plac of the P1N1 (bottom) architectures in response to signals received at three different phases (red dots in (d) and (e)). The dashed line is the activity of the promoter in the absence of the signal.

