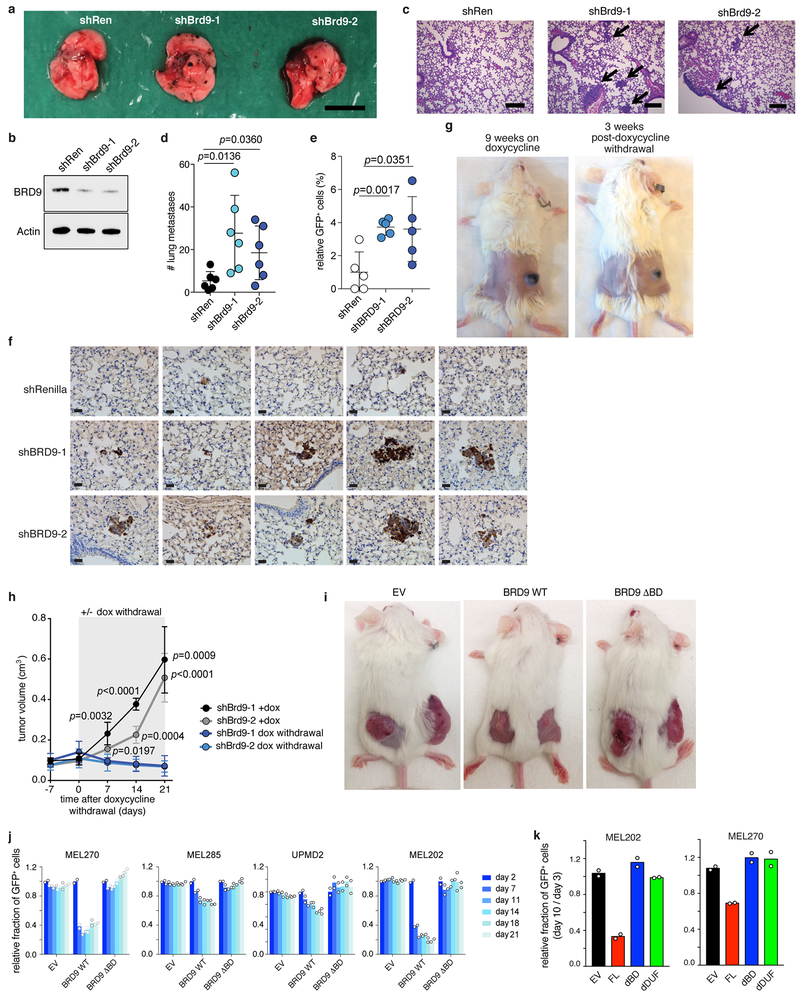
Extended Data Figure 6. BRD9 is a potent tumor suppressor in UVM.
(a) Representative images of pulmonary metastatic foci produced 14 days after intravenous injection of B16 cells with or without shBrd9 (MLS-E vector). Scale bar indicates 5 mm.
(b) Western blot of endogenous BRD9 in B16 cells immediately prior to injection. Actin, loading control. The experiment was repeated three times with similar results.
(c) H&E sections of lung metastases. Arrows indicate metastatic foci. Scale bar indicates 100 μm. The experiment was repeated three times with similar results.
(d) Numbers of pulmonary B16 metastases identified in the experiments from (a). n=6 per group. p-value was calculated relative to the shRen group by a two-sided t-test.
(e) Relative percentages of GFP+ 92.1 cells with or without shBRD9 (MLS-E vector), assessed by flow cytometric analysis of lung tissue in recipient NSG (NOD-scid IL2R-γ null) mice 14 days following intravenous injection by tail vein. The signal was normalized by dividing by the average percentage of GFP+ cells in the shRen (control) group. n=5 biologically independent experiments per group. p-value was calculated relative to the shRen group by a two-sided t-test.
(f) Anti-GFP immunohistochemistry for sections of lung metastases from the experiment in (e). Scale bar indicates 200 μm. The experiment was repeated three times with similar results.
(g) Representative images of tumors derived from transplantation of Melan-a cells transduced with dox-inducible shBrd9. Doxycycline was administered for 9 weeks (left) and followed by doxycycline withdrawal for 3 weeks (right).
(h) Tumor volume for the experiment in (g). n=4 mice per group. The experiment was repeated twice with similar results. p-value was calculated relative to the parental group by a two-sided t-test at day 7, 14, and 21.
(i) Representative images of recipient mice engrafted with MEL270 cells transduced with empty vector (EV), full-length BRD9 (WT), or a bromodomain deletion mutant of BRD9 (BRD9 ΔBD) at day 12. n=5 per group.
(j) Results of a competition assay to measure the effects of expression of the indicated cDNAs on growth of the indicated melanoma cells. Transduced cells were identified by co-expression of GFP (pMIGII vector). The percentage of GFP+ cells was tracked over 21 days and normalized to the GFP percentage on day 2. Data are presented as mean ± SD. n=2 per group.
(k) Results of a competition assay to measure the effects of expression of the indicated cDNAs on growth of the indicated melanoma cells. Transduced cells were identified by the co-expression of GFP (pMIGII vector). The percentage of GFP+ cells was tracked over 10 days and normalized to the GFP percentage on day 3. n=2 per group.

