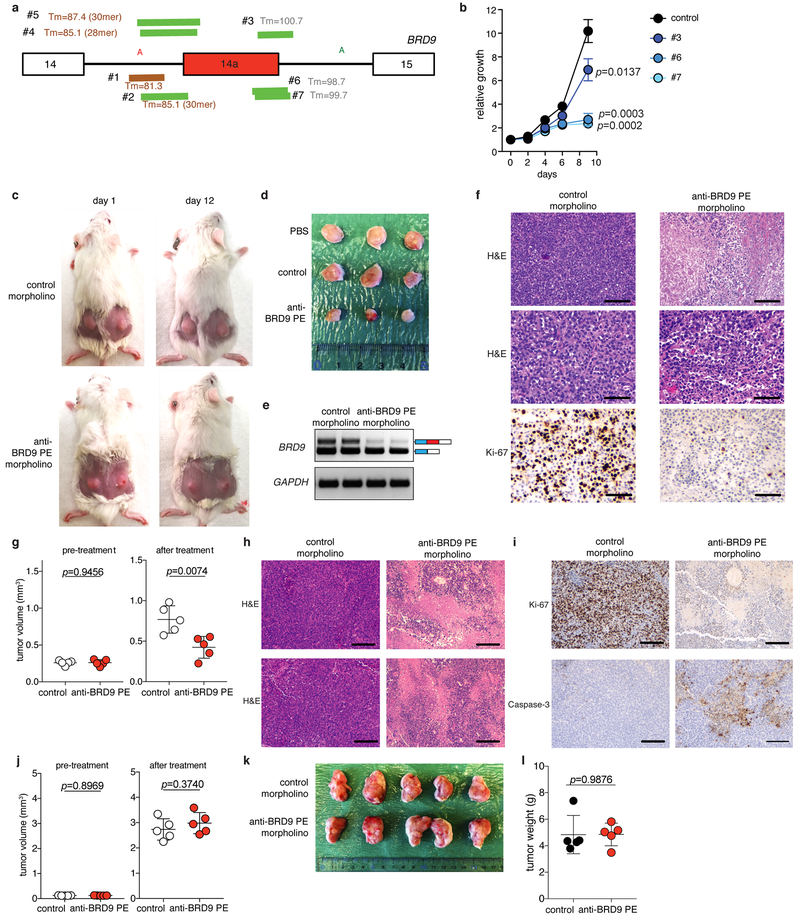
Extended Data Figure 9. Correcting BRD9 mis-splicing in SF3B1-mutant xenografts with antisense oligonucleotides suppresses tumor growth.
(a) Cartoon representation of the BRD9 loci targeted by each designed morpholino. Melting temperature (Tm) is shown. Length of target sequences are indicated in parentheses; if not indicated, then length is 25 nt.
(b) Growth of MEL202 cells (SF3B1R625G) treated with 10 uM of control non-targeting (control) or BRD9 poison exon-targeting morpholinos (#3, #6, #7). n=3 biologically independent experiments per group. p-value at day 9 was calculated relative to the control group by a two-sided t-test.
(c) Representative images of recipient mice xenografted with MEL202 cells and treated with PBS or morpholinos in vivo. Each tumor was analyzed after in vivo treatment with PBS, control morpholino, or anti-BRD9 PE morpholino (#6; 12.5 mg/kg, every other day, 8 intratumoral injections). n=10 per group.
(d) Representative images of dissected tumors from the experiment described in (c).
(e) RT-PCR results of tumors from (c) to evaluate BRD9 splicing. The experiment was repeated three times with similar results.
(f) Representative hematoxylin and eosin (H&E) and Ki-67 staining images of tumors from (c). Scale bar indicates 100 μm (top) and 50 μm (middle and bottom). The experiment was repeated three times with similar results.
(g) Estimated tumor volume for recipient mice transplanted with a PDX model of SF3B1R625C rectal melanoma and treated with in vivo morpholinos (control or anti-BRD9 PE morpholino #6; 12.5 mg/kg, every other day, 8 intratumoral injections). n=5 per group. Estimated tumor volumes before and after treatment are shown. Data are presented as mean ± SD. p-value was calculated relative to the control group by a two-sided t-test.
(h) Representative H&E staining images of tumors from (g). The experiment was repeated three times with similar results.
(i) Representative Ki-67 staining images of tumors from (g). The experiment was repeated three times with similar results.
(j) Estimated tumor volume for recipient mice transplanted with a PDX model of SF3B1-WT UVM and treated with in vivo morpholinos (control or anti-BRD9 PE morpholino #6; 12.5 mg/kg, every other day, 8 intratumor injections). n=5 per group. Estimated tumor volumes before and after treatment are shown. Data are presented as mean ± SD. p-value was calculated relative to the control group by a two-sided t-test.
(k) Representative images of dissected tumors from (j).
(l) Tumor weight for tumors from (k). n=5 per group. p-value was calculated relative to the control group by a two-sided t-test.

