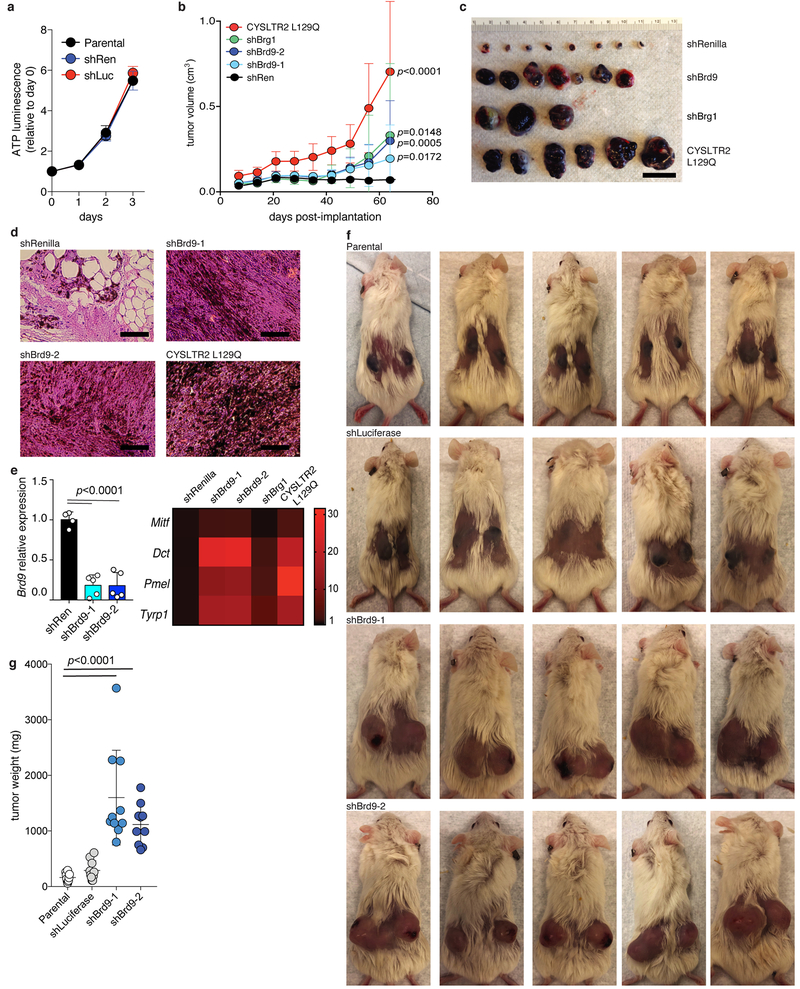
Extended Data Figure 5. BRD9 is a potent tumor suppressor in UVM.
(a) In vitro growth curves of Melan-a cells treated with two distinct non-targeting shRNAs (shRenilla (“shRen”), shLuciferase (“shLuc”)) versus parental, unmanipulated Melan-a cells. n=3 per group. Data are presented as mean ± SD.
(b) Tumor volume in SCID mice subcutaneously injected with Melan-a cells expressing a control shRNA (shRen), shRNA against Brd9 (shBrd9-1 and shBrd9-2), shRNA against Brg1 (shBrg1), or cDNA encoding CYSLTR2 L129Q (n = 8 mice per group). Data are presented as mean ± SD. p-value at day 64 was calculated compared to shRen group with a two-sided t-test.
(c) Representative images of the dissected melanomas from (b).
(d) Hematoxylin and eosin (H&E) images of melanomas from (b). Scale bar indicates 100 μm. Representative images from n=3 biologically independent experiments.
(e) Quantitative RT-PCR measuring expression of Brd9 (left) and melanoma-associated genes (Mitf, Dct, Pmel, and Tyrp1) of melanomas from (a). n=4 (shRen) and n=5 (shBrd9-1 and shBrd9-2) biologically independent experiments. Data are presented as mean ± SD. p-value was calculated by two-sided t-test.
(f) Images of mice transplanted with parental, unmanipulated Melan-a cells or Melan-a cells transduced with a non-targeting shRNA or Brd9-targeting shRNA. Cells were subcutaneously engrafted into SCID mice and tumor volume was estimated 36 days after transplant.
(g) Volumes of tumors from (f) at day 36. Data are presented as mean ± SD. n=10 per group. p-value was calculated relative to the parental group by a two-sided t-test.

