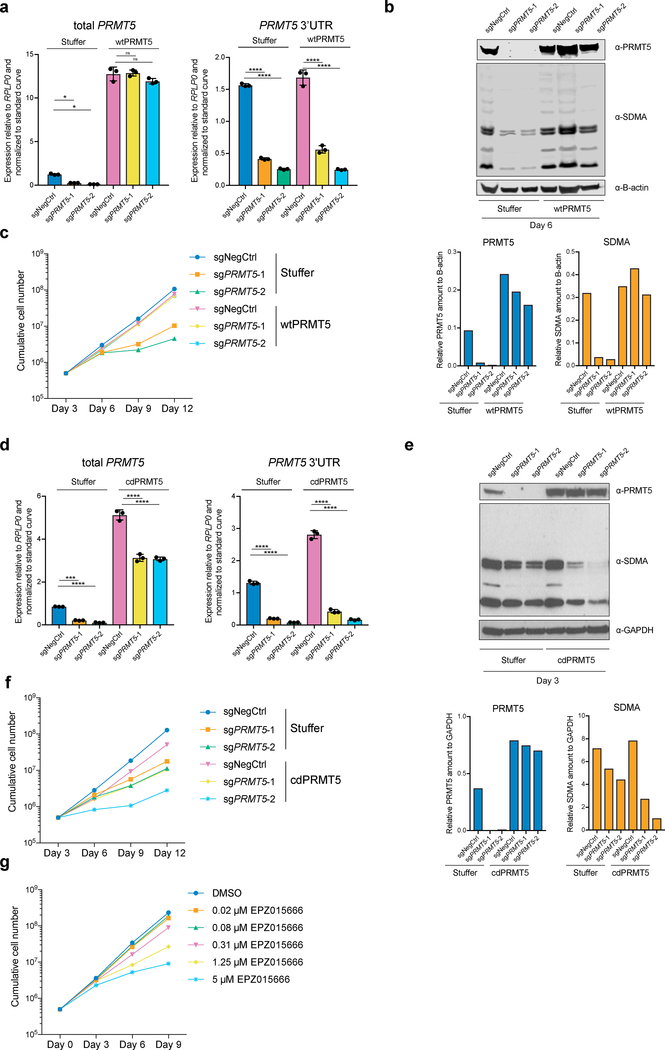
Figure 1. The catalytic activity of PRMT5 is required for proliferation of mouse and human MLL-AF9-rearranged AML cells.
a, qRT-PCR analysis of total and endogenous PRMT5 expression in THP-1-cdCas9-KRAB-stuffer or wtPRMT5 cells transduced with either a non-targeting (NegCtrl) sgRNA or two sgRNAs against PRMT5. The values are normalized to RPLP0 and shown as mean ±SD (n=3 technical replicates, * is p < 0.05, **** is p < 0.0001, “ns” is not significant according to Sidak’s multiple comparisons test). b, Western blot analysis of PRMT5 and B-actin expression and symmetrical arginine dimethylation (SDMA) levels in THP-1-cdCas9-KRAB-stuffer or wtPRMT5 cells transduced with either a non-targeting (NegCtrl) sgRNA or two sgRNAs against PRMT5 six days after transduction. Bar chart shows quantification of protein levels relative to a loading control. c, Growth curves of THP-1-cdCas9-KRAB-stuffer or wtPRMT5 cells transduced with either a non-targeting (NegCtrl) sgRNA or two sgRNAs against PRMT5. X-axis indicates number of days after transduction. d, qRT-PCR analysis of total and endogenous PRMT5 expression in THP-1-cdCas9-KRAB-stuffer or cdPRMT5 cells transduced with either a non-targeting (NegCtrl) sgRNA or two sgRNAs against PRMT5. The values are normalized to RPLP0 and shown as mean ±SD (n=3 technical replicates, *** is p < 0.001, **** is p < 0.0001 according to Sidak’s multiple comparisons test). e, Western blot analysis of PRMT5 and GAPDH expression and symmetrical arginine dimethylation (SDMA) levels in THP-1-cdCas9-KRAB-stuffer or cdPRMT5 cells transduced with either a non-targeting (NegCtrl) sgRNA or two sgRNAs against PRMT5 three days after transduction. Bar chart shows quantification of protein levels relative to a loading control. f, Growth curves of THP-1-cdCas9-KRAB-stuffer or cdPRMT5 cells transduced with either a non-targeting (NegCtrl) sgRNA or two sgRNAs against PRMT5. X-axis indicates number of days after transduction. g, Growth curves of THP-1 cultured in DMSO or with the PRMT5 inhibitor EPZ015666 at different concentrations. X-axis indicates number of days after addition of the compound. The experiments in a-c, g were repeated three times independently with similar results. The experiments in d-f were repeated twice with similar results. Source data for a-g are available online. The uncropped westerns blots for b and e are shown in the Source Data.

