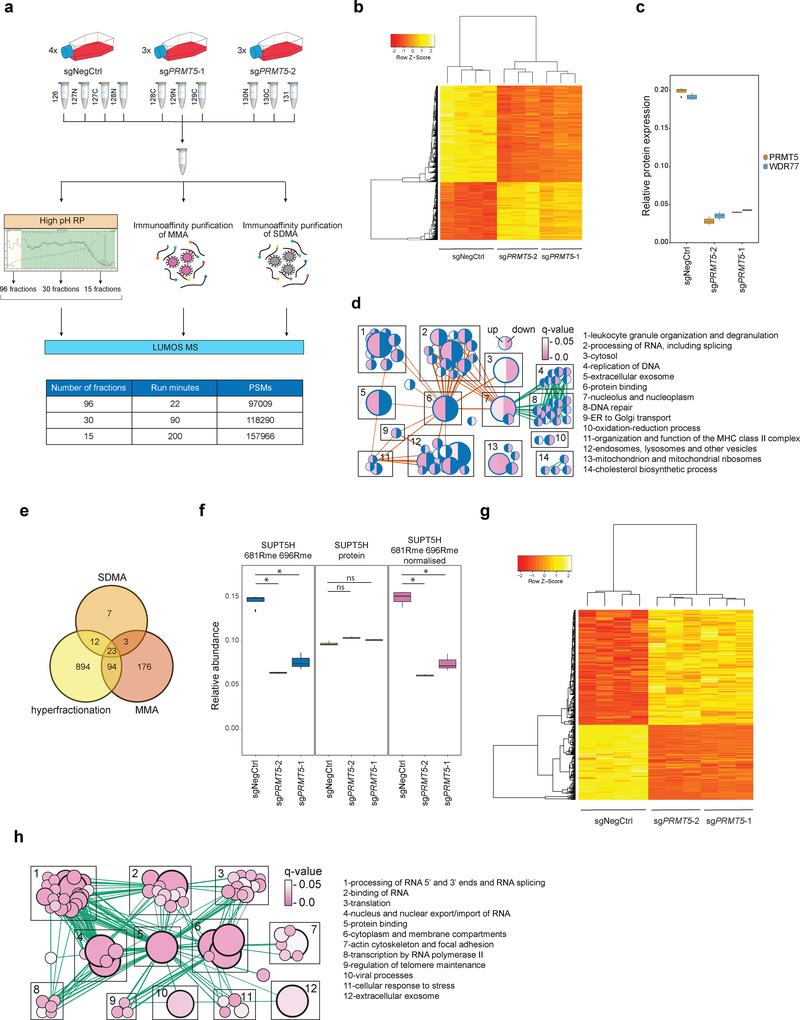
Figure 2. Proteome and methylome profiling identify novel PRMT5 substrates in human AML cells.
a, Outline of the proteome and methylome profiling strategies in THP-1-cdCas9-KRAB cells transduced with a non-targeting sgRNA (NegCtrl) or two independent sgRNAs against PRMT5 (see methods for details). MMA = monomethylated arginine, SDMA = symmetrically dimethylated arginine, high pH RP = high pH reverse phase chromatography, PSMs = peptide spectrum matches. b, Heatmap of 2962 differentially expressed proteins (q-value ≤ 0.05 in both sgRNAs, limma test, with p-values adjusted by Storey method). c, Boxplot representing relative protein abundance of PRMT5 and its co-factor WDR77 in THP-1-cdCas9-KRAB cells transduced with non-targeting sgRNA (NegCtrl) or two independent sgRNAs against PRMT5. Boxplot summary: outliers (points), minimum (lower whisker), first quartile (lower bound of box), median (horizontal line inside box), third quartile (upper bound of box), interquartile range (box), and maximum (upper whisker). For PRMT5-depleted cells, n=3 independently transduced samples. For wild-type cells, n=4 independently transduced samples. The difference between the negative control and each of the knockdown sgRNA is statistically significant (q-value < 0.05, limma test, with p-values adjusted by Storey method). d, Gene Ontology-based functional classification of 2962 up- and downregulated proteins in THP-1 cells following PRMT5 knockdown (two-sided Fisher’s exact test, FDR-adjusted p-value < 0.05). The nodes represent significantly enriched protein sets, node size is proportional to the number of members in a protein set, and color intensity reflects the q-value. Edges indicate the protein overlap between the nodes with thicker edges indicating higher degree of overlap. Orange edges illustrate upregulated categories, green – downregulated. Functionally related protein sets are clustered, numbered and named. Blue color in half circles indicates no enriched categories. e, Venn diagram representing the number of methylated peptides identified using the strategies outlined in Fig.2a. f, An example of normalization of the arginine methylation site quantified against the protein level. 681R and 696R methylation sites of SUPT5H were quantified as decreasing upon PRMT5 knockdown, while the SUPT5H protein itself was, conversely, slightly upregulated. Hence, normalization results in the increased fold change for methylation site quantification. Rme = arginine methylation. Boxplot summary as in c. For PRMT5-depleted cells, n=3 independently transduced samples. For wild-type cells, n=4 independently transduced samples. g, Heatmap of 420 differentially methylated sites. (q-value ≤ 0.1 in both sgRNAs, limma test, with p-values adjusted by Storey method). h, Enrichment map of the Gene Ontology-enriched protein sets across 61 identified potential PRMT5 targets. Representation and statistics as in panel d. The proteomics experiments were performed using three independently transduced samples of PRMT5-depleted cells (two independent sgRNAs) and four independently transduced samples of wild-type cells. Source data are available in Supplementary Table 1.

