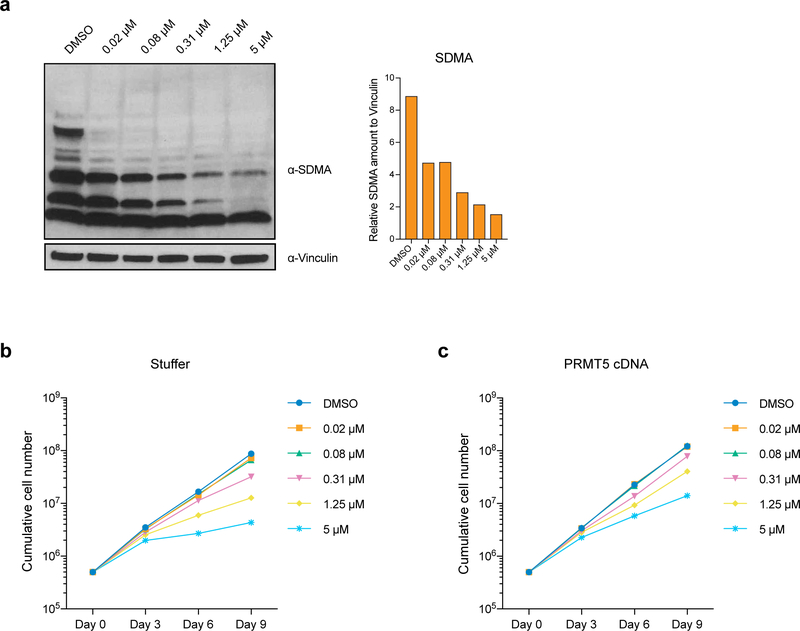
Extended Data Fig. 2. Chemical inhibition of PRMT5 leads to growth defects in AML cells.
a, Western blot analysis of symmetrical arginine dimethylation (SDMA) levels and Vinculin in THP-1 cells treated with DMSO or different doses of PRMT5 inhibitor EPZ015666 at 6 days after the addition of a compound. Bar chart shows quantification of protein levels relative to a loading control. b, Growth curves of THP-1-cdCas9-KRAB-stuffer cells treated with DMSO or different doses of PRMT5 inhibitor EPZ015666. X-axis indicates number of days after addition of the compound. c, Growth curves of THP-1-cdCas9-KRAB-wtPRMT5 cells treated with DMSO or different doses of PRMT5 inhibitor EPZ015666. X-axis indicates number of days after addition of the compound. The experiments were repeated twice with similar results. The uncropped western blots are available in the Source Data.

