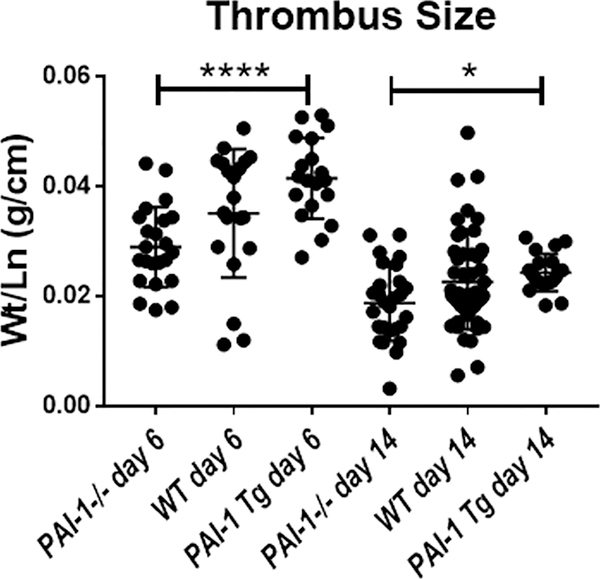
Figure 3. Functional assessment of PAI-1 in murine models.
Inferior vena cava venous thrombus size was measured at day 6 and day 14 after inferior vena cava ligation in PAI-1 Tg (day 6 N = 19; day 14 N = 20), wild type (day 6 N = 20; day 14 N = 49), and PAI-1 −/− mice (day 6 N =23; day 14 N =27). Thrombus size was observed to be larger in the PAI-1 Tg mice compared to PAI-1−/− mice (one-way analysis of variance followed by Tukey’s multiple comparisons post hoc test, *p=0.02, ****p<0.0001). A scatter dot plot depicting mean thrombus size ± standard deviation is shown.
Abbreviations: PAI-1, Plasminogen Activator Inhibitor-1; Tg, Transgenic; WT, Wild Type

