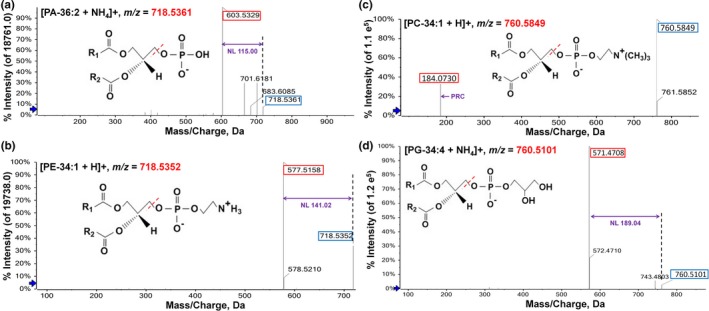
Figure 4.

Comparison of representative precursor ions adducts with close m/z and their characteristic fragmentation ions. (a) and (b), the m/z was 718.5361 of PA‐36:2 and 718.5352 of PE‐34:1, respectively. Neutral loss of PA was 115.00 and PE was 141.02. (c) and (d), the m/z was 760.5849 of PC‐34:1 and 760.5101 of PG‐34:4, respectively. The m/z of head group of PC was 184.07 and neutral loss of PE was 189.04. The number in blue frame was the m/z of precursor ion adduct and red frame was the m/z of that product ion adduct. Purple number was the m/z of characteristic fragmentation ion adduct (neutral loss). NL, neutral loss
