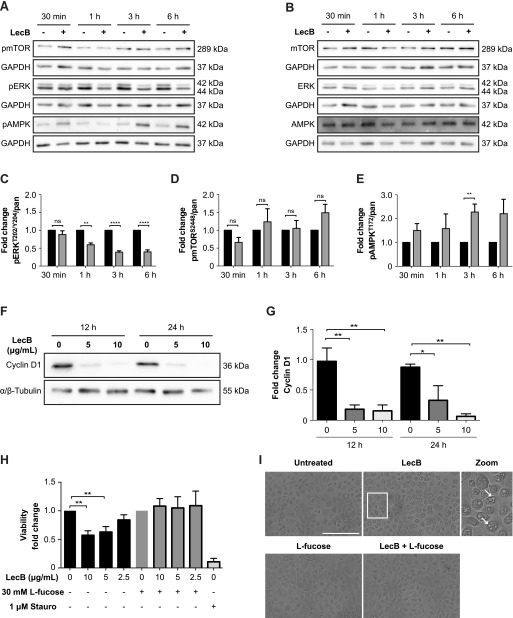
Figure 3. LecB impairs cell survival signalling pathways and leads to cell cycle arrest.
(A, B, C, D, E) Representative blots and relative quantifications of N = 3 independent experiments. NHKs were treated with 5 μg/ml LecB for the indicated time and lysates were subjected to SDS–PAGE and Western blot analysis using the designated anti-phospho (A) and anti-pan antibodies (B). GAPDH was added as loading control. Graphs (C, D, E) depict the fold change of the phosphorylated protein compared with pan levels and represent the mean value ± SEM. ** denotes P < 0.01, **** denotes P < 0.0001, ns denotes not significant; multiple t tests were used for statistical analysis. (F) Western blot showing cyclin D1 levels after 12 and 24 h of LecB stimulation (5 or 10 μg/ml). (G) Quantification of cyclin D1 relative to tubulin. The mean value ± SEM of N = 3 independent experiments is reported. * denotes P < 0.05, ** denotes P < 0.01; one-way ANOVA was used for statistical analysis. (H) MTT assay assessing the cytotoxic effect of LecB. NHKs were treated with the indicated LecB concentration with or without 30 mM L-fucose for 24 h. Staurosporine (1 μM) was used as positive control. MTT was added to the medium and left for 4 h. The absorbance at 570 nm was measured and plotted as fold change compared with the untreated or L-fucose–treated sample. The mean value ± SEM of N = 5 is plotted. ** denotes P < 0.01; one-way ANOVA was used for statistical analysis. (I) Representative images of keratinocyte monolayers after 24-h exposure to 5 μg/ml LecB with or without 30 mM L-fucose. White arrows in the zoomed image point at vacuolar structures induced by lectin treatment. Scale bar: 200 μm.

