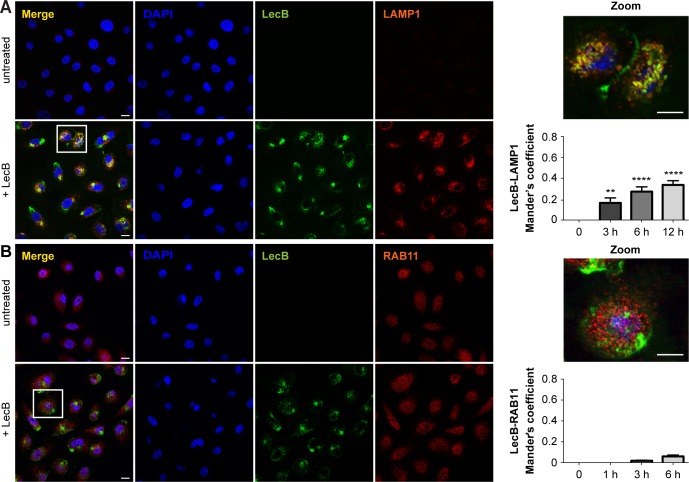
Figure S5. LecB colocalises with LAMP1 positive compartments.
(A, B) Confocal micrographs of NHKs stimulated with 5 μg/ml of fluorescently labelled LecB (green) permeabilised and stained for (A) LAMP1 and (B) RAB11 (both in red). Panels indicated as “+LecB” refer to 12-h incubation. Note that LAMP1 signal in the untreated panel is not visible due to the high difference in intensity between untreated and treated conditions. Scale bar: 10 μm. Graphs right to the panels show the quantification of Mander’s overlap coefficients between LecB and LAMP1 and LecB and RAB11. Error bars indicate means ± SEM of N = 3 independent experiments. ** denotes P < 0.01, **** denotes P < 0.0001; one-way ANOVA was used for statistical analysis.

