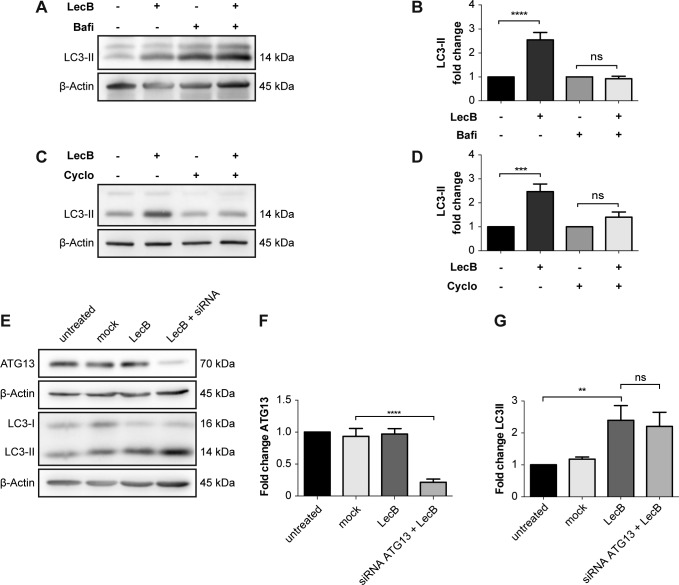
Figure S6. LecB-mediated increase of LC3-II is ATG13 independent.
(A, B, C, D) Representative blots and relative quantifications. The cells were treated with 5 μg/ml of LecB for 12 h ± 200 nM bafilomycin A1 (Bafi) or ±20 μg/ml cycloheximide (Cyclo). Whole-cell lysates were probed for LC3 and β-actin was used as loading control. (A, B, C, D) Graphs indicate the fold change of LC3-II levels, expressed as means ± SEM of N = 4 (A, B) and N = 6 (C, D) independent experiments. *** denotes P < 0.001, **** denotes P < 0.0001, ns denotes not significant; one-way ANOVA was used for statistical analysis. (E, F, G) ATG13 was silenced via siRNA and its expression quantified by Western blot (F). (G) Silenced cells were treated with LecB for 3 h and LC3-II levels were quantified (G). Graphs report the mean value ± SEM of N = 4 independent experiments. ** denotes P < 0.01, **** denotes P < 0.0001, ns denotes not significant; one-way ANOVA was used for statistical analysis.

