
Figure 2.
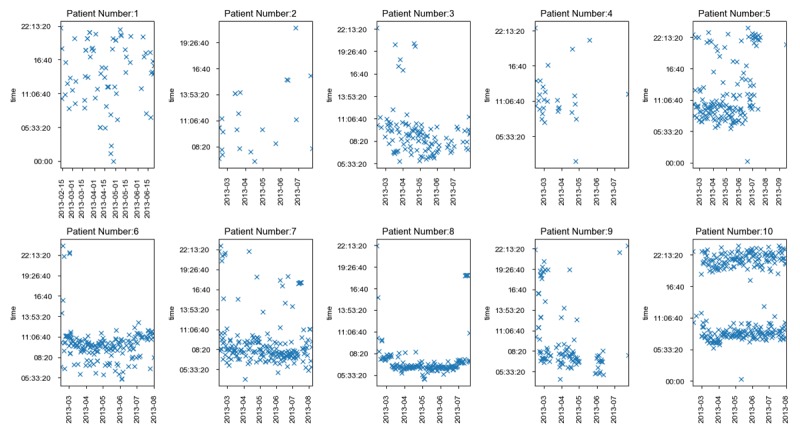
Time distribution of self-monitored blood glucose level collection by the patients over the clinical trial. The x-axis represents the date and the y-axis represents the time of the day that data has been collected. If the same date has two recorded times, that means the patient has collected their blood glucose twice in the same day.