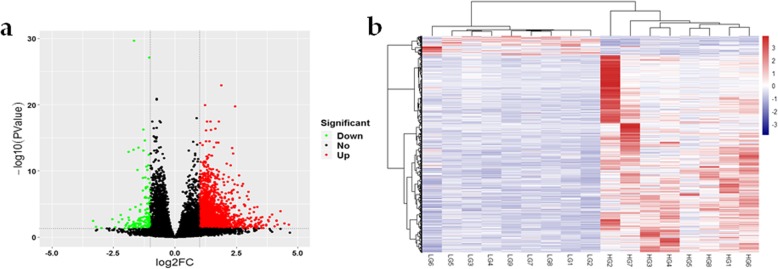
Fig. 2.
The results of the RNA sequencing analysis. a Volcano plot. The red dots (Up) represent significantly upregulated genes, the green dots (Down) represent significantly downregulated genes (|log2 fold change (FC)| ≥ 1 and false discovery rate (FDR) < 0.05), and the black dots (No) represent insignificantly differentially expressed genes (DEGs). b Hierarchical clustering analysis. Hierarchical clustering analysis was performed based on DEGs, the heat-maps of all 17 samples revealed that the gene expression profiles in same group were closely related

