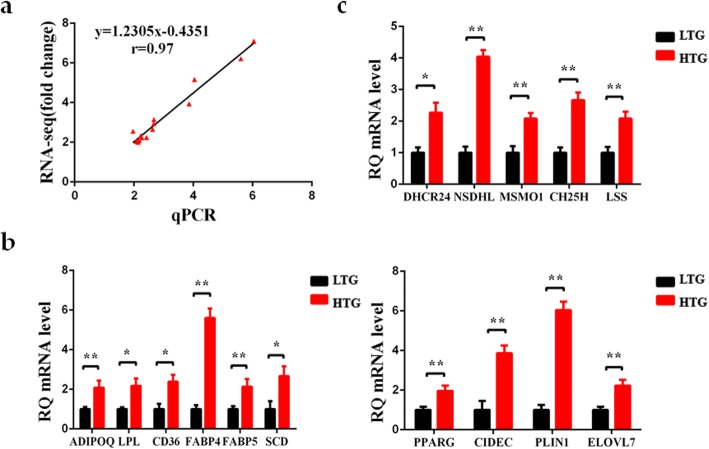
Fig. 3.
Validation of the RNA sequencing analysis data by quantitative real-time PCR (qRT-PCR) analysis. a Correlation analysis of the relative expression levels of 15 differentially expressed genes (DEGs) between the RNA sequencing and qRT-PCR (r = 0.97, p < 0.05). b-c Expression level of representative genes involved in TG and steroid metabolism by qRT-PCR in the HTG and LTG chickens. All genes were significantly upregulated in the HTG group compared with LTG group. Data are presented as the mean ± SEM (*p < 0.05 or ** p < 0.01). RQ: relative quantification

