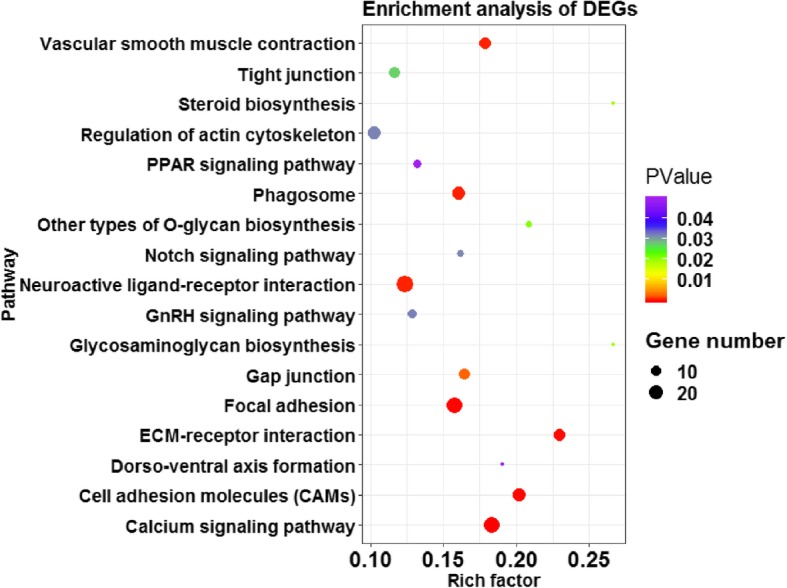
Fig. 4.

Advanced bubble chart shows significantly enriched pathways based on differentially expressed genes (DEGs) by Kyoto Encyclopedia of Genes and Genomes (KEGG) pathway analysis (p < 0.05). The x-axis represents rich factor (rich factor = number of DEGs enriched in the pathway/number of all genes in the background gene set). The y-axis represents the enriched pathway. Color represents enrichment significance, and the size of the bubble represents the number of DEGs enriched in the pathway
