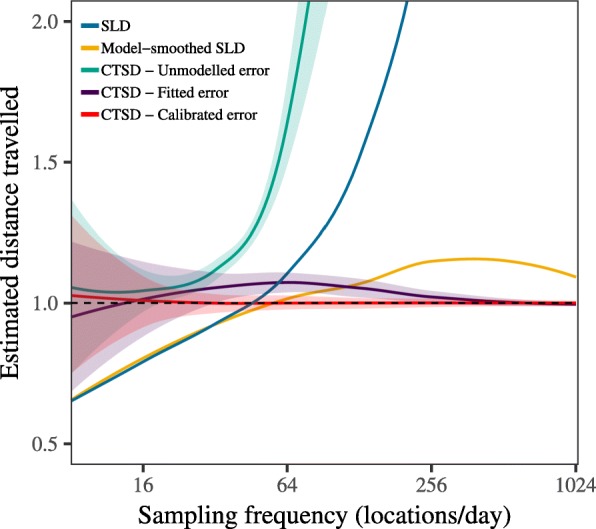
Fig. 6.

The results of simulations quantifying distance traveled via straight line displacement (SLD), and the continuous-time (CTSD) estimates from three different model fitting approaches; i) fitting the movement model without an error model; ii) fitting the movement and error models simultaneously; and iii) fitting the movement and error models separately via error calibration. The solid lines depict the mean accuracy, and the shaded areas the 95% CIs (SLD estimates, both model-smoothed and conventional, do not come with CIs). The dashed line at y = 1 depicts the true value to which the estimates should converge and the x-axis is log scaled
