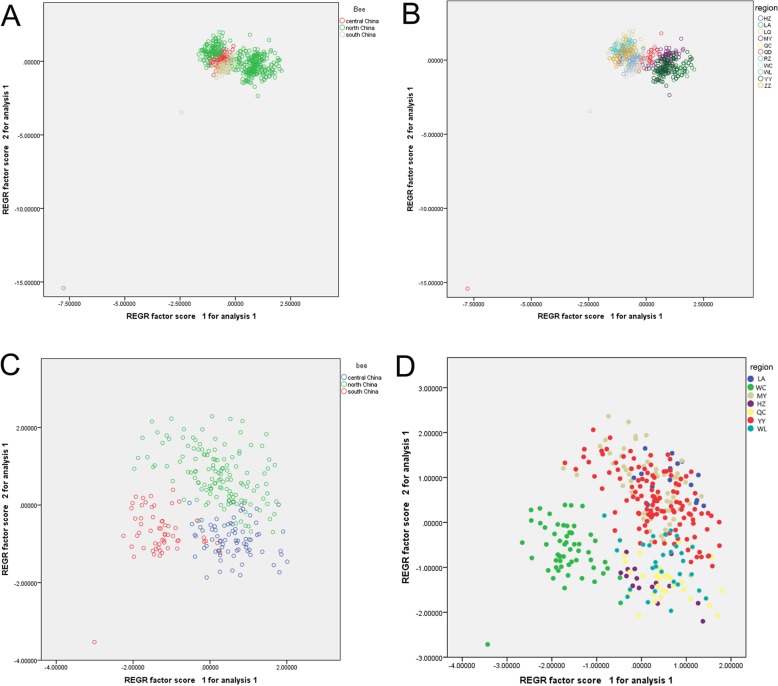
Fig. 3.
Principal component analysis of the population structure in different regions of A. cerana. a Scatter plot of the main component 1 to 2 (PCA1 vs PCA2) from North China, Central China, and Hainan. b Scatter plot of the main component 1 to 2 (PCA1 vs. PCA2) from the 11 regions of LA, WC, LQ, MY, QD, RZ, HZ, QC, YY, ZZ, and WL (c) After removing the regions of RZ, ZZ, LQ, and QD, the RZ, ZZ, LQ, and QD regions were removed according to the sampling region in the scatter plot (d) of the main factor 1 and main factor 2. The main factor 1 and main factor 2 were passed according to the sampling region in the scatter plot

