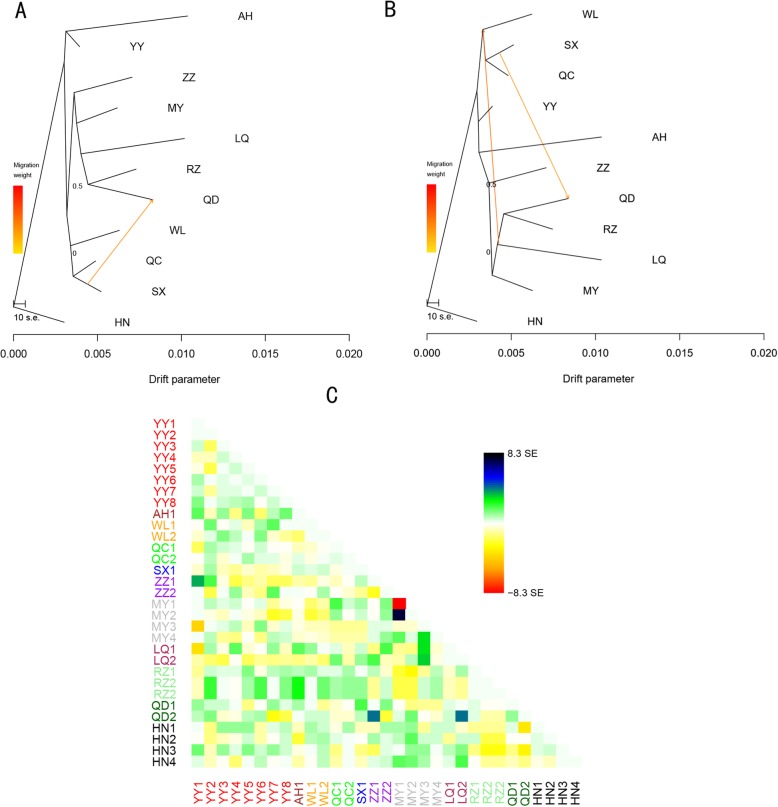
Fig. 5.
a Maximum likelihood tree with two migration event. The different regions are colored according to the geographical location, and the scale shows 10 times the average standard error of the sample covariance matrix W. b Maximum likelihood tree with two migration events. c Residual map of the residual fit of the maximum likelihood tree calculated using 31 populations without migration. We divided the mean standard error between all pairs of residual covariances i and j between each pair of populations. We then plotted the scaled residual. The color is described in the palette on the right. A positive residual value indicates that the groups are more closely related to each other

