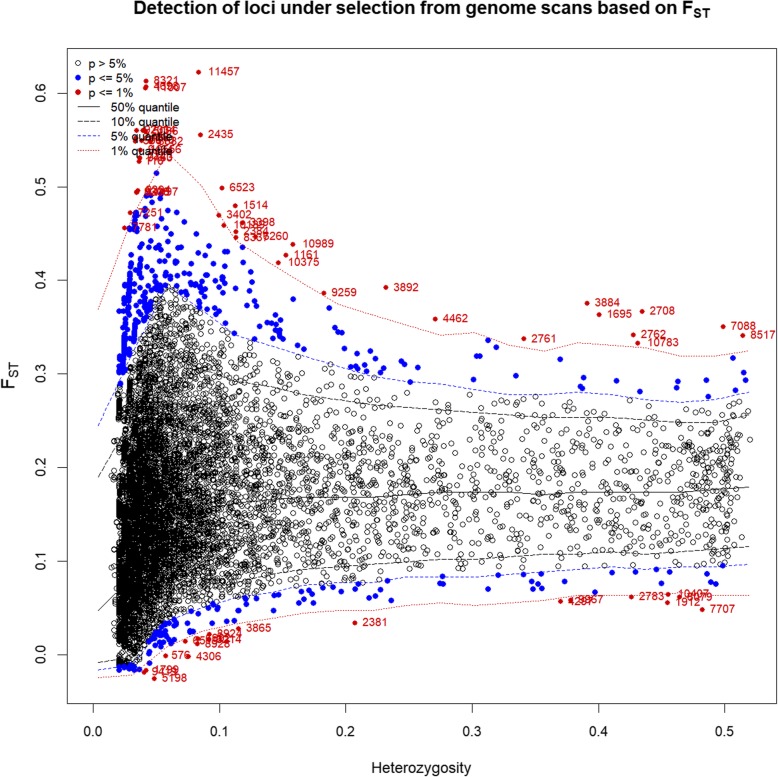
Fig. 7.
Identifies the different SNP loci assumed under the selection of the direction of the Fst outlier method. Use The hierarchical model Arlequin 3.5. was used. Fst: site-specific genetic differences between populations; heterozygosity: a measure of heterozygosity at each locus. Significant sites are indicated by red dots (P < 0.01)

