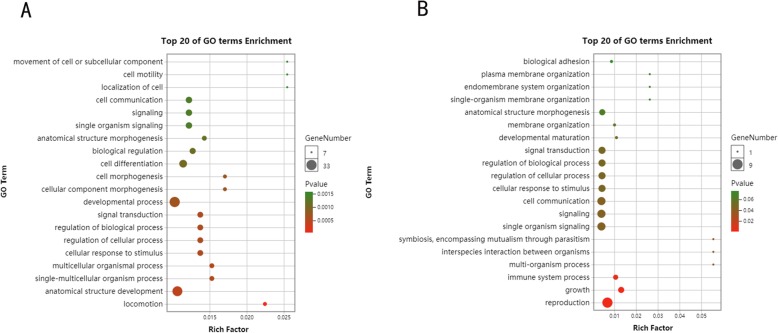
Fig. 9.
The left image shows the top 20 GO terms under directional selection, and the right image shows the top 20 GO terms under balanced selection. Rich Factor: Ratio of enriched gene number to total gene number in each GO term. Dot size were decided with enrichment gene number. Dot color were decided with enrichment p-value

