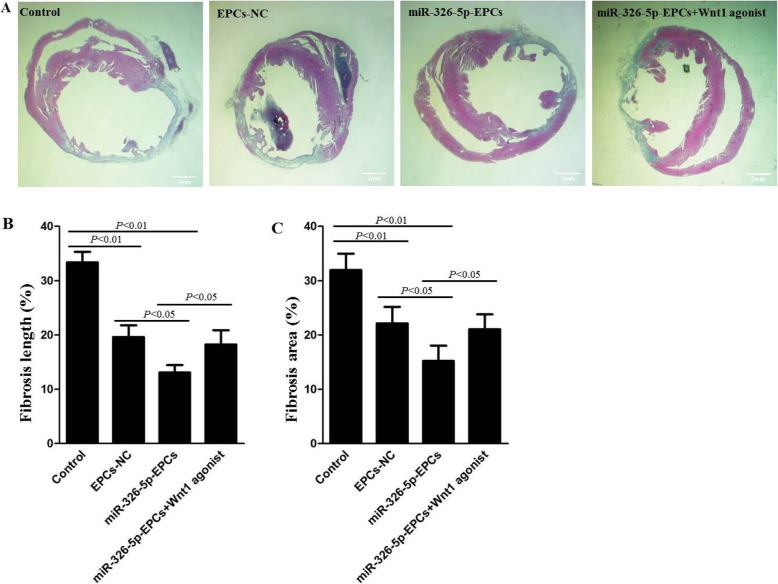
Fig. 5.
Histological analysis of myocardial infarction (MI) sizes in each group. After MI was inducted, miRNA-326-5p-EPCs (EPCs were transfected with miRNA-326-5p), miRNA-326-5p-EPCs+ Wnt1 agonist, EPCs-NC, and PBS control were injected into the peri-infarct zones. Heart samples in each group were harvested at 28 days after the operation. a Cardiac fibrosis was indicated by staining with Masson’s trichrome: scarred fibrosis (blue), myocardium (red). Bar, 2 μm. The percentage of fibrosis length (b) and fibrotic area (c) were calculated and averaged by using Image J software

